AfterClimate’s 2022 emissions, plus a prototype method for monitoring & measuring in the work-from-home era

With 2022 now squarely in the rear view mirror, it’s time to start thinking about the annual emissions reporting process. I make a point of emphasising that the games industry needs to lead by example and get its own emissions down before spending too much time and energy trying to nudge players to do similar. As a business, AfterClimate wouldn’t be walking our talk if we weren’t also trying to do the same – so today we’re publishing a best-guess estimate of our emissions. We’re also putting it out there for other teams who want to do the same sort of active measurement of WFH energy consumption. Because, as is the case for many studios post-pandemic, figuring out how much energy (and emissions) has been used is not always as straightforward as it once was.
One of the challenges that has impacts on teams both large and small is the increasing amount of work done from home. It’s something I wrote about in Digital Games After Climate Change though it was still in the early stages of the work-from-home revolution. The crux of the issue comes from how household power metering works – power used in the home office is no different to power used in the kitchen, the bedroom, the laundry, the shed, etc. It’s all measured by the one power meter for the entire household. This means that private energy consumption is mixed in with work consumption, because they’re both behind the same household meter. Here’s what I wrote about it back in June last year:
One issue that cropped up (in my 2020 survey of game developers) was the challenge of disaggregating data for work-from home developers. The problem comes from the fact that when you WFH your work and personal energy are mixed together in the one electricity bill, and so the figures reported for individual WFH developers ended up higher than for some whole teams of multiple developers working in a dedicated office space.
This problem has only intensified, with an almost immediate and lasting shift to working from home seen across the entire games industry, as in much of the rest of the world.
In response, the main approach has been to develop estimates of WFH emissions – picking different amounts to attribute to work done at home based on either the hardware used at home, or some other calculation. There are even some really surprising and counter-intuitive results depending on where in the world an individual is based, what mode of transport they use to get to work, and so on.
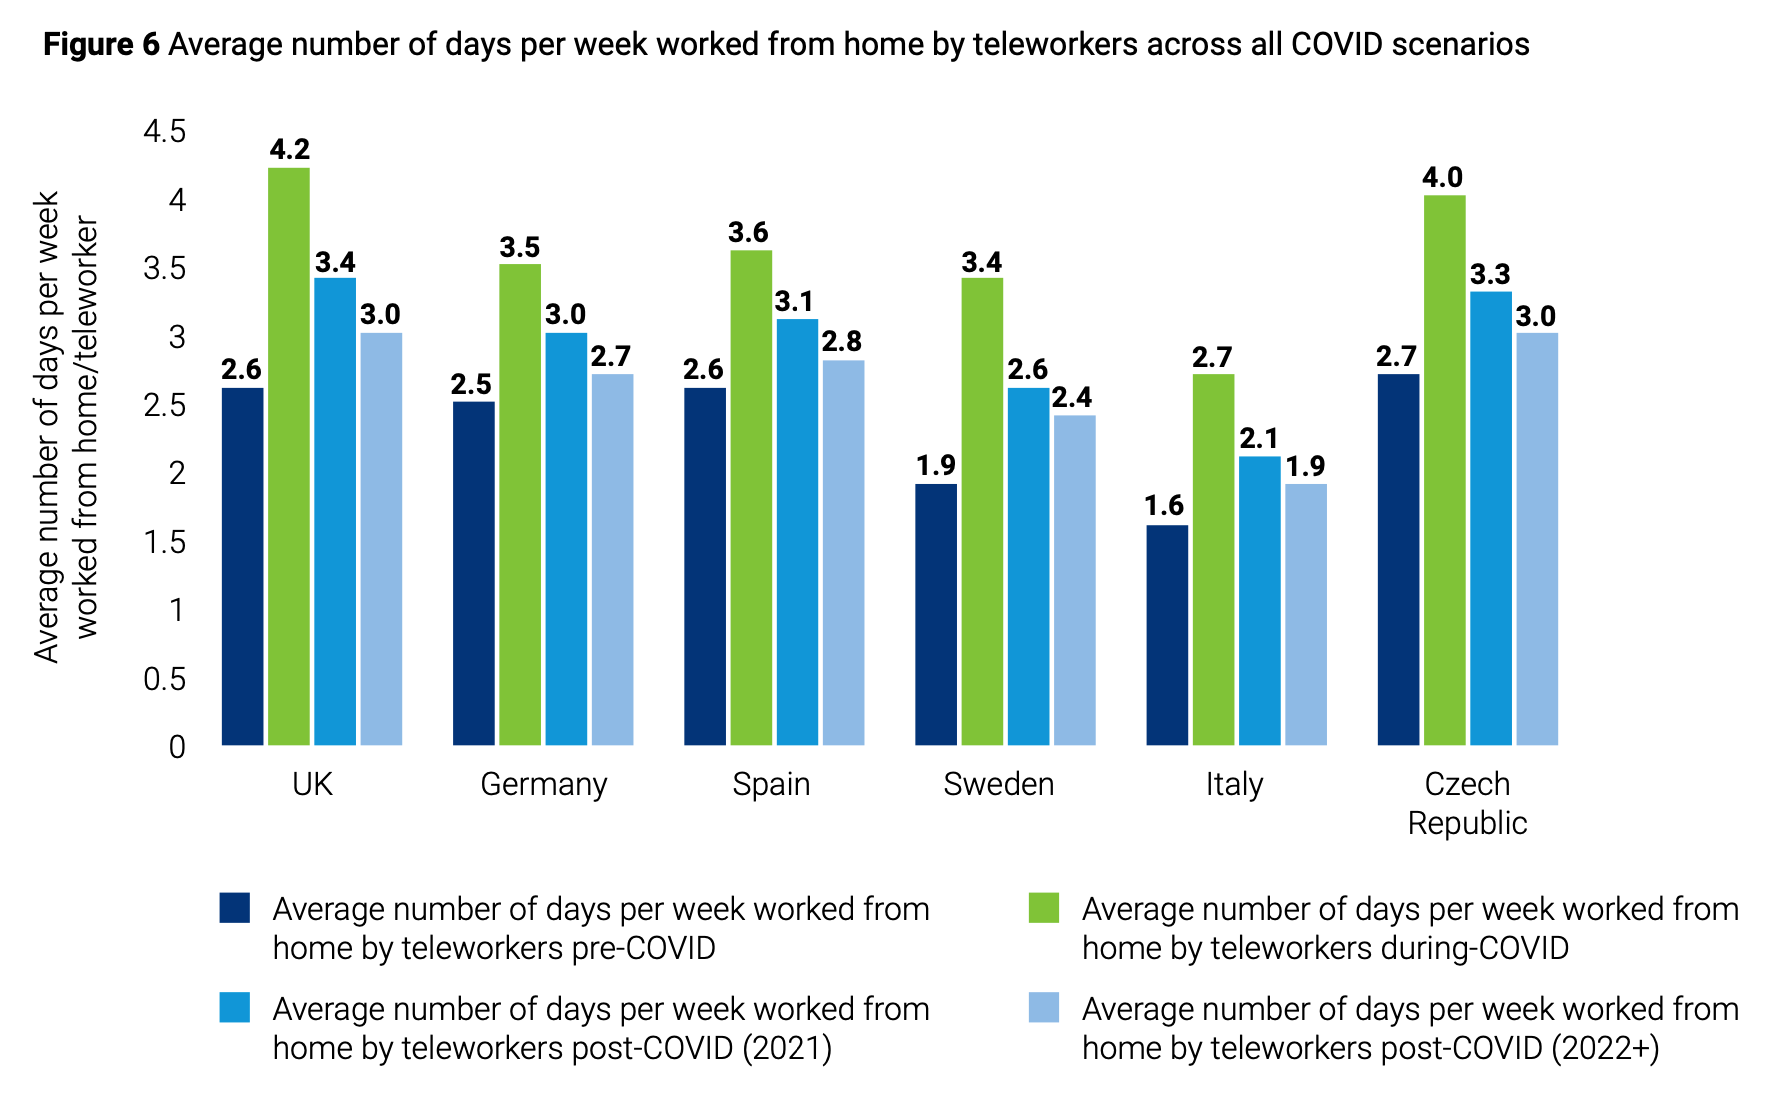
Carbon Trust produced a fantastic analysis of the potential emissions savings from WFH on emissions in Europe in 2021. In general, they found that WFH produced substantial emissions reductions – with some provisos and caveats. To see why its such a dramatic shift, here’s a chart showing the effect on average number of days worked from home (by those workers who did work from home) from pre-covid, till now:
The major benefit of WFH is the avoidance of emissions from commuting – especially if that involves avoiding individuals getting in cars every day. But WFH also produces an increase in energy consumption in the home – because people are there, keeping their house warmer or cooler for longer, cooking lunches, making video calls, using more lighting and networking equipment, and so on. And yet, even after all that, on the whole WFH still saves emissions – as this chart shows (though not that much in certain contexts):
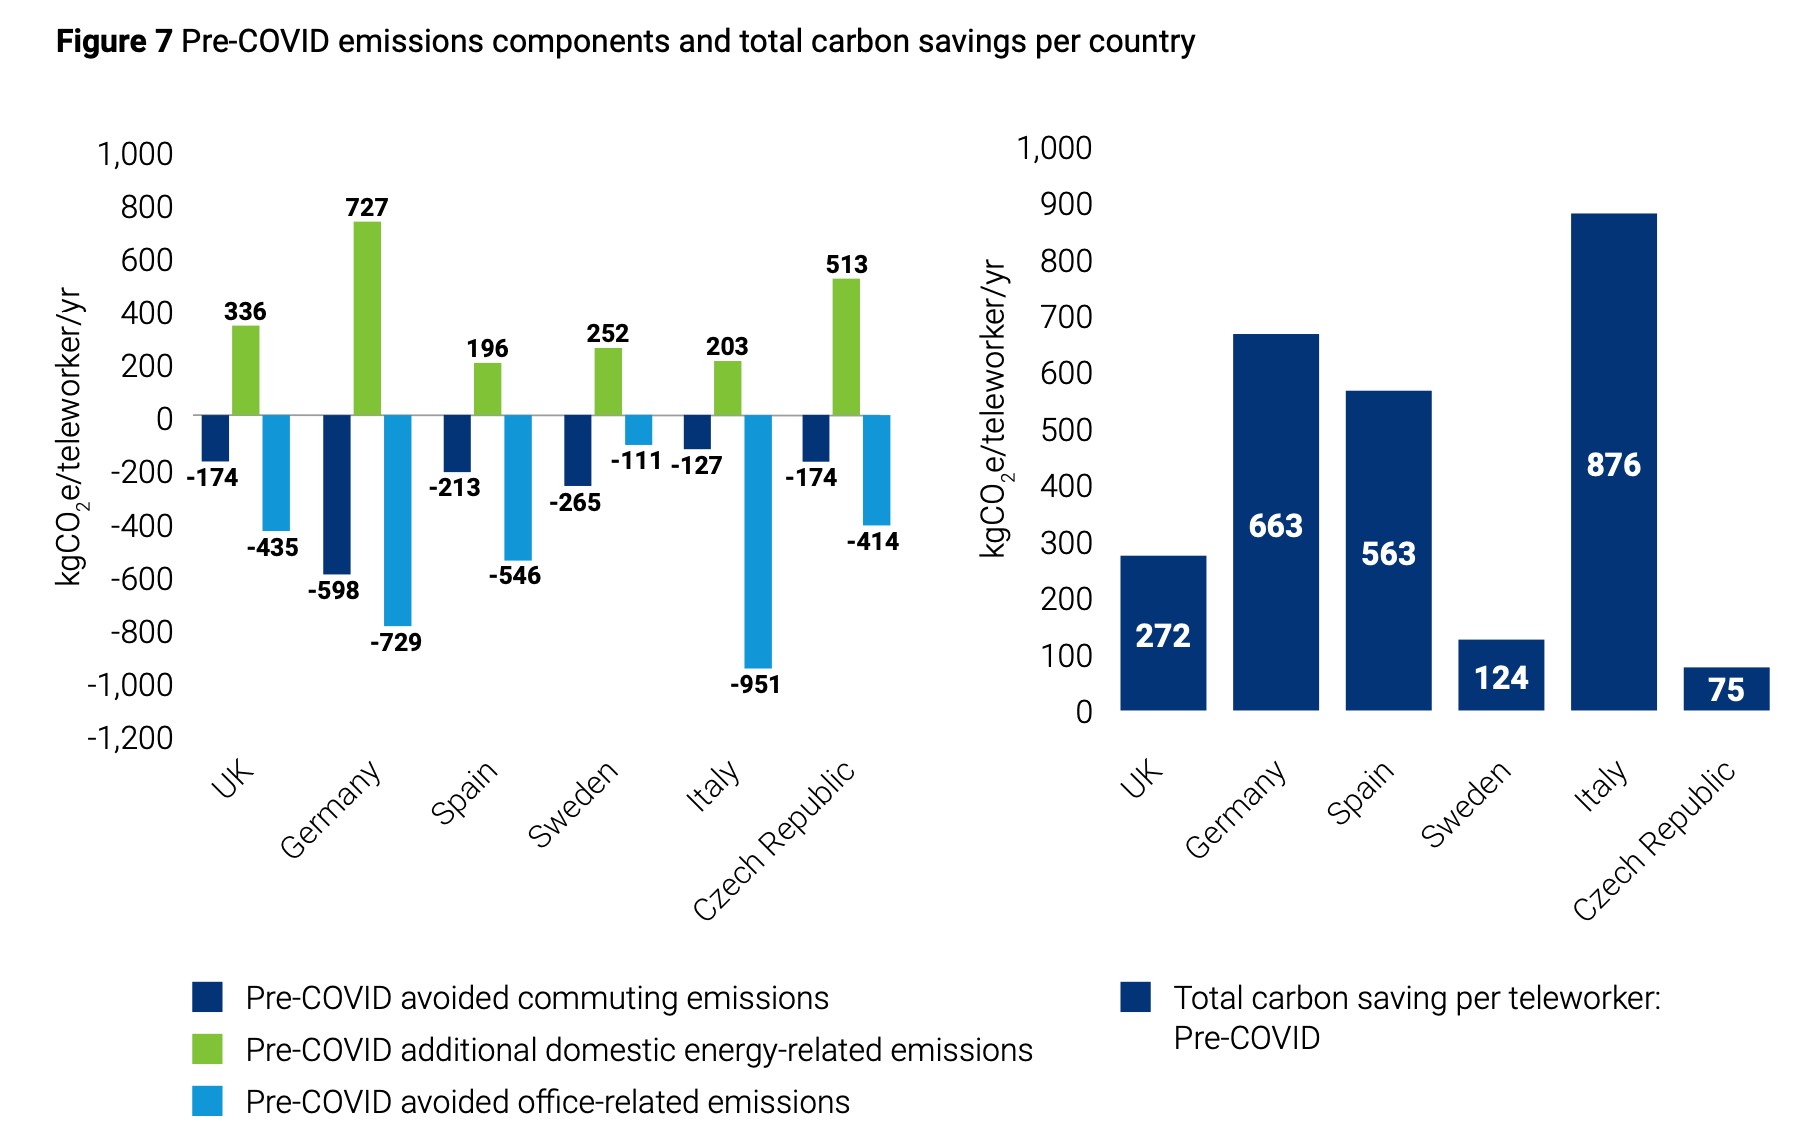
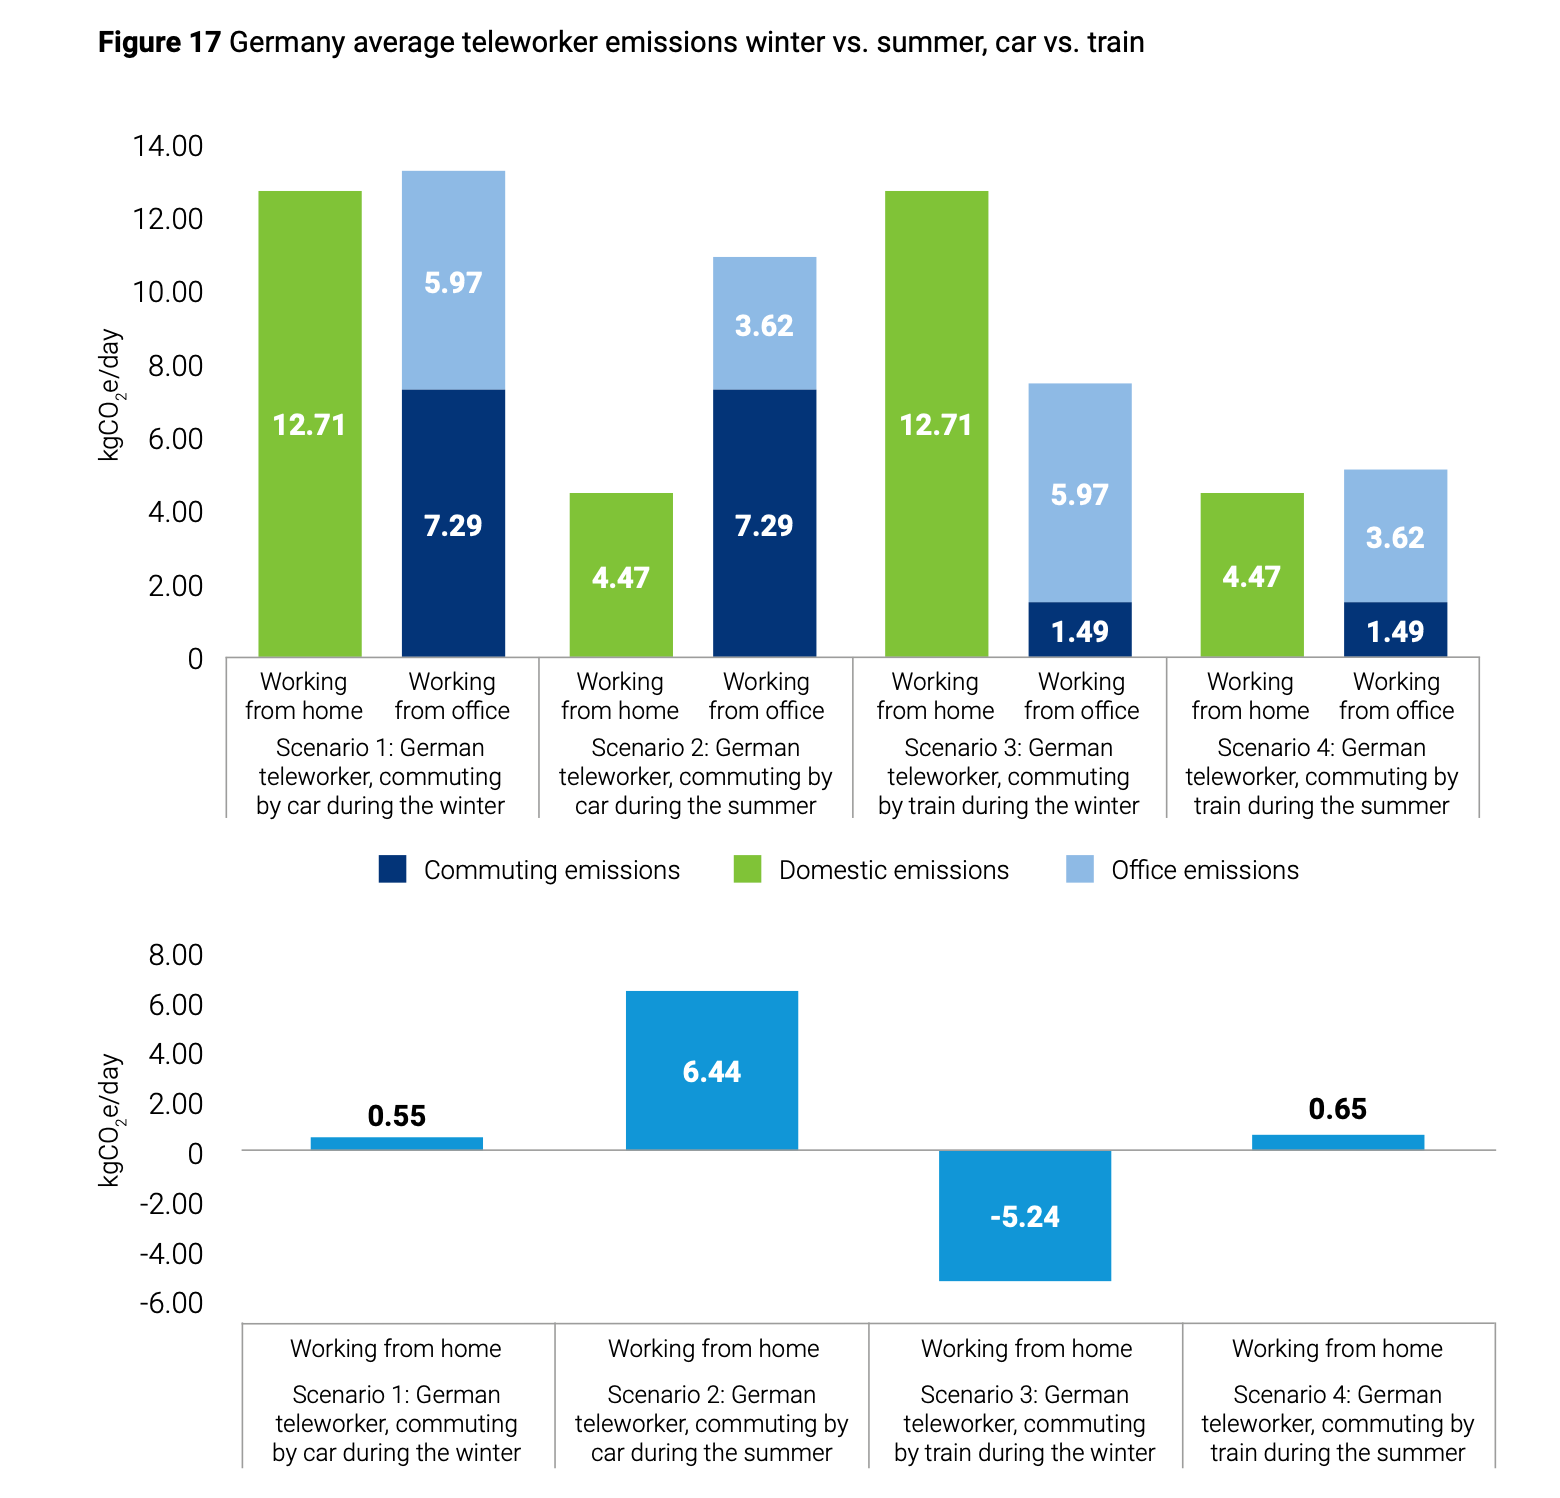
Why does it not prevent much in the way of emissions in Sweden and the Czech Republic? Well those are cold climate countries, and so by keeping workers at home for longer, you’ve now spread out heating demand across multiple homes instead of clustering them together in one single office (ideally, a really energy efficient one). This also means that there are some scenarios where the savings from WFH can actually be negative – as in you increase emissions. As the next chart shows, if a WFH-er in Germany was originally commuting to work by train, its actually possible that its more emissions intense for them to stay home at certain times of the year because of the increased heating used at home, which cancels out the savings from avoiding an already low emission commute.
So while in total the picture is highly favourable regarding WFH, it’s not quite as straightforward across the board. And its for exactly this kind of reason that I think it's always worth collecting data directly whenever possible. Estimates are good, even unavoidable a lot of the time, but there’s nothing like having actual real-world measurements to hand.
So how do we collect work from home energy consumption? One type of solution is to use ‘behind the meter’ measurement of electricity, but this is mostly the preserve of large firms, with large buildings with lots of subsystems (server rooms, plants, etc). It isn’t really possible in the home, since these systems can be expensive and require professional set up. For smaller businesses and indie game developers, what we can do instead is measure specific devices, or even groups of devices.
To measure my work power, I got hold of a Meross smart power plug – here’s an Australian plug version listed on Amazon for $36 for two. In this device you get a wifi connected power plug, rated for up to 10 amps / 2400 kW (plenty for a 4-outlet powerboard with a computer, monitor and one or two other devices) that will actively record the amount of power that passes through it. There’s also an app to see these figures live, and it also saves daily totals to a cloud database. At the start of the year, there was only the app interface to view this saved data, but by the end of the year Meross had added a feature to request a download link of all your consumption data as a CSV file. How simple is that!
So here’s the data from what was connected to my power plug in 2022 – from Jan 20th to Dec 31st. This is just my WFH office computer power consumption, as I only kept my main 24” iMac (circa 2019 – bought secondhand) plugged into it. This is pretty close to the full picture for AfterClimate’s work Scope 2 emissions – though I also have a MacBook air laptop as well, and there's maybe one or two other things we could include, like heating and cooling via reverse cycle AC (figuring out for these is a different kettle of fish, however, so we'll leave that for now). But as an indication of the energy profile and consumption patterns from this particular device, the main one we use for work, it’s a pretty good measure.
Here’s the data from that plug in spreadsheet form if you want to dig through it a bit or see how I worked anything out. If you just want to see a nice chart, the daily power consumption graphed across the whole year looks like this:
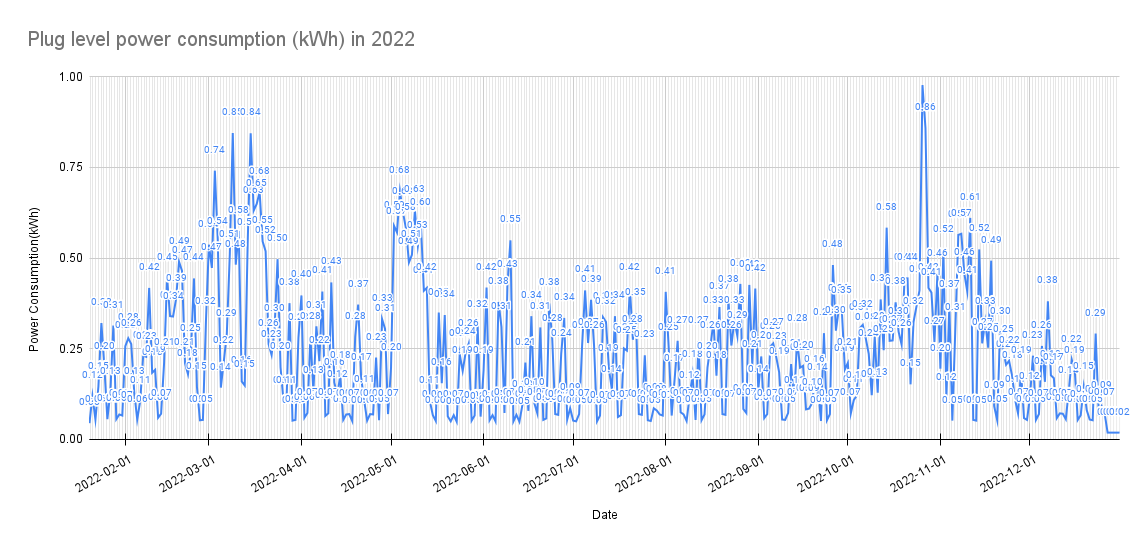
Peaks of energy consumption in March, May and October coincide with periods of more intense work for me, which is a nice bit of confirmation that we're getting something representative. I think the highest peak (0.86 kWh in October) was one of the days in which I was working on what would become the 2022 net zero snapshot.
Totalling up all those daily figures across the year (minus the first few weeks of Jan) my work done on this iMac used 80.14 kWh of electricity – which seems like a pretty decent amount for a computer, even though on most days it never went much higher than about 0.25 kWh. But even small amounts all add up over time.
If I were to use the GHG Protocol Scope 2 ‘location based method’ for calculating my electricity emissions for this device, what does 80.14 kWh amount to in emissions? The Australian state I live in (New South Wales) had an emissions factor of 0.73 kg of CO2e per kWh in 2022. If I used only power from the grid last year, that would add up to a extremely moderate 58.5 kg of CO2e for the whole year, or 1/200th of a ton of CO2e.
But that’s not all – on top of this power consumption data I now have, I also have access to production data from the solar panels on my roof (that's some of them at the top of this post). We have a 6.6 kW array (with an inverter capable of producing 5 kW) and for most of the year this provides almost all of the daytime power we use in our entire house. We still have cloudy days, and during winter when the sun is low and the panels get shaded by a nearby tree, our production nosedives. But it covers a lot of what we use.
To know for sure how much my work computer was powered by NSW’s polluting power grid or not, I would need to be able to see data even more granular, and track power imports and exports throughout the day. Suffice to say, that’s impractical at this scale, and definitely not possible yet with this setup (though maybe one day). Instead, as a proxy I can compare the ratio of exported power (which is fed back into the grid, with a very very small credit to our power bill) to the amount of power used by my work machine.
This isn’t a perfect indicator, because the power consumed by it is across the whole day (including evenings, when I do sometimes have to hold meetings for those in other timezones) but it’s an reasonable indicator of how much excess power we had during a day. Across 2022 there were only 26 days in the whole year where we didn’t export at least 15x more electricity than my iMac consumed for that day. In fact, there were only three whole days in the year where the ratio went below 1:1 (i.e. where we didn’t at least match the amount my computer used in terms of exports). Neat.
And lastly, to cap it all off, in our household we purchase electricity from Co-Power, a power retailer that operates on cooperative basis, and which is doing great things to shake up Australia’s privatised and for-profit power industry. If you’re in Aus and you’re not with Co-Power, you’re missing out on being part of a great experiment in building collective power (pun intended, I grudgingly admit) and helping to take back some of the control that governments have handed over by privatising the power system. Co-Power purchases offsets (booo) to cover their customers emissions for the year, though I have yet to dig into where they are getting them from (hopefully not from REDD forestry credits). They also provide an option to pay a premium on top of your per-kWh energy price to purchase renewable energy certificates to cover your usage (I have not taken up this option – maybe eventually I’ll make that switch).
So that’s it – that’s how we figured out what sort of energy use (and emissions!) doing what we do at AfterClimate is having – or most of them anyway – even though we work from a home office. We monitored our main device, did some simple spreadsheeting, and calculated the totals. When compared to our solar exports, I’m pretty confident that most of the power we use (Scope 2 emissions!) is covered by our solar – at least for the majority of the year.
So does AfterClimate still have an emissions footprint then? Certainly, yes, there are parts of our full Scope 3 we haven’t looked at yet, but our direct emissions – the ones most under our control (Scope 1 and Scope 2) are about as close to zero as we can currently get them for now. We don’t use gas or other fossil fuels in our home (since we did an all electric renovation in May 2021 and ditched the gas cook top for induction – and I have never looked back) and we generate a lot of our own power, usually more than enough to feed it back into the grid. We're lucky in that we currently own our home, and are blessed with bountiful solar resources that fall from the sky almost every day of the year in this part of Australia. That's not always an option for everyone, but measuring your WFH energy with a similar approach might be.
I hope seeing the process gives you some ideas about how you might add real on-the-ground data collection to your GHG inventory processes, and end up with greater confidence in the figures you arrive at. This same process that I’ve described here is one we have been testing out with an actual game studio – with Paper House in Melbourne adopting the same plug based approach late last year. I’m hoping that in few weeks-to-months I’ll be able to give an update on what we are finding out by measuring their home energy consumption as well.
By the way: have you seen the Wood & Weather trailer yet? It absolutely rules.
If you’ve got any questions about how we did this data collection process or want some help setting a solution like this set up for your team or studio – get in touch!