How does the typical game developer get to work?

If you follow my work with the Sustainable Games Alliance on LinkedIn (or on our discord – which you should join), you’ll have already seen that we recently announced the completion of a new component of the SGA Scope standard.
As a quick refresher, the SGA standard is a set of methodologies specifically for game developers, that can be used by anyone making games to produce accurate, comparable, and above all actionable greenhouse gas emissions data. It follows the same structure as the Greenhouse Gas Protocol, with 3 Scopes of emissions – Scope 1 direct fossil fuel emissions from combustion or release of GHGs, Scope 2 indirect fossil fuel emissions from the various sources of electricity you purchase and use, and Scope 3 all the other sprawling, complex mess that is too easily overlooked as “someone else’s emissions” from the entire value chain of game making. (Think: console hardware, other software providers, data centres, digital and physical distribution, even gamers playing games)
Before we launched the SGA in August, we actually worked on a draft of the Scope 1 & 2 component of the standard – and that’s been available on the website for a while now. The whole standard is still a bit of a work in progress. But we’re now well underway and chipping off pieces of the remaining work. We’re properly tackling the biggest remaining parts of game biz footprints through Scope 3 emissions and the fifteen different categories of these the GHG Protocol describes.
The first component we’ve worked on is what the GHG Protocol calls Scope 3 Category 7 employee commuting. I’ve been focussing on how to refine the methodologies that the GHG Protocol provides and make them applicable to games in ways that both improve the accuracy of measurements we make and also give users of the standard’s methodologies better insight into how they choose to do business impacts their footprint.
The methodology involves collecting an employee survey, which we settled on after considering the undesirable effects of surveillance or obtrusive observation of employees. Many of the SGA member organisations said that they were uncomfortable with the idea of collecting observations of staff from swipe cards, timesheets, and other real-time systems of surveillance (and rightly so, I think). So self-reporting employee surveys is the way to go. We can ask people “What does your typical work week look like?” along with some specifics about how they get to work, how far they go, and by which modes, but that's about as detailed as we want to get.
Most companies have some experience in carrying out staff surveys already, so it can slot into existing employee engagement processes. These don’t always have the best response rates (game developers are busy people), so we also need to take that into account. Special thanks to Tommi Lappalainen in particular for sharing his experience with completion rates across Rovio’s team, which was an important reality check.
So we take our collected employee data, making sure to collect the days that employees usually work from the office, the days they usually work from home, as well as the mode of travel they take to get to/from work (if they do go to an office). There are plenty of fully remote development teams these days, in which case they just have physical commuting days equal to zero. We also want to know how far staff travel by whichever mode they go the furthest (assuming that people might take more than one mode of transport, particularly for the last short part of the trip).
If we successfully collect all that data for every employee we could very easily come up with a near-perfect measurement of physical commuting. But alas, we don’t live in a perfect world, and we will almost certainly get imperfect or incomplete data, with some percentage of people not completing it for whatever reason. So we need a method to estimate or extrapolate for the remainder, in the absence of data. Here we can draw on increasingly available public research on urban mobility, an increasing priority for cities and planners of all stripes. Take the city of Copenhagen, and The Danish National Travel Survey (in Danish: Transportvaneundersøgelsen, TU) [PDF] which most recently published results from 2021.
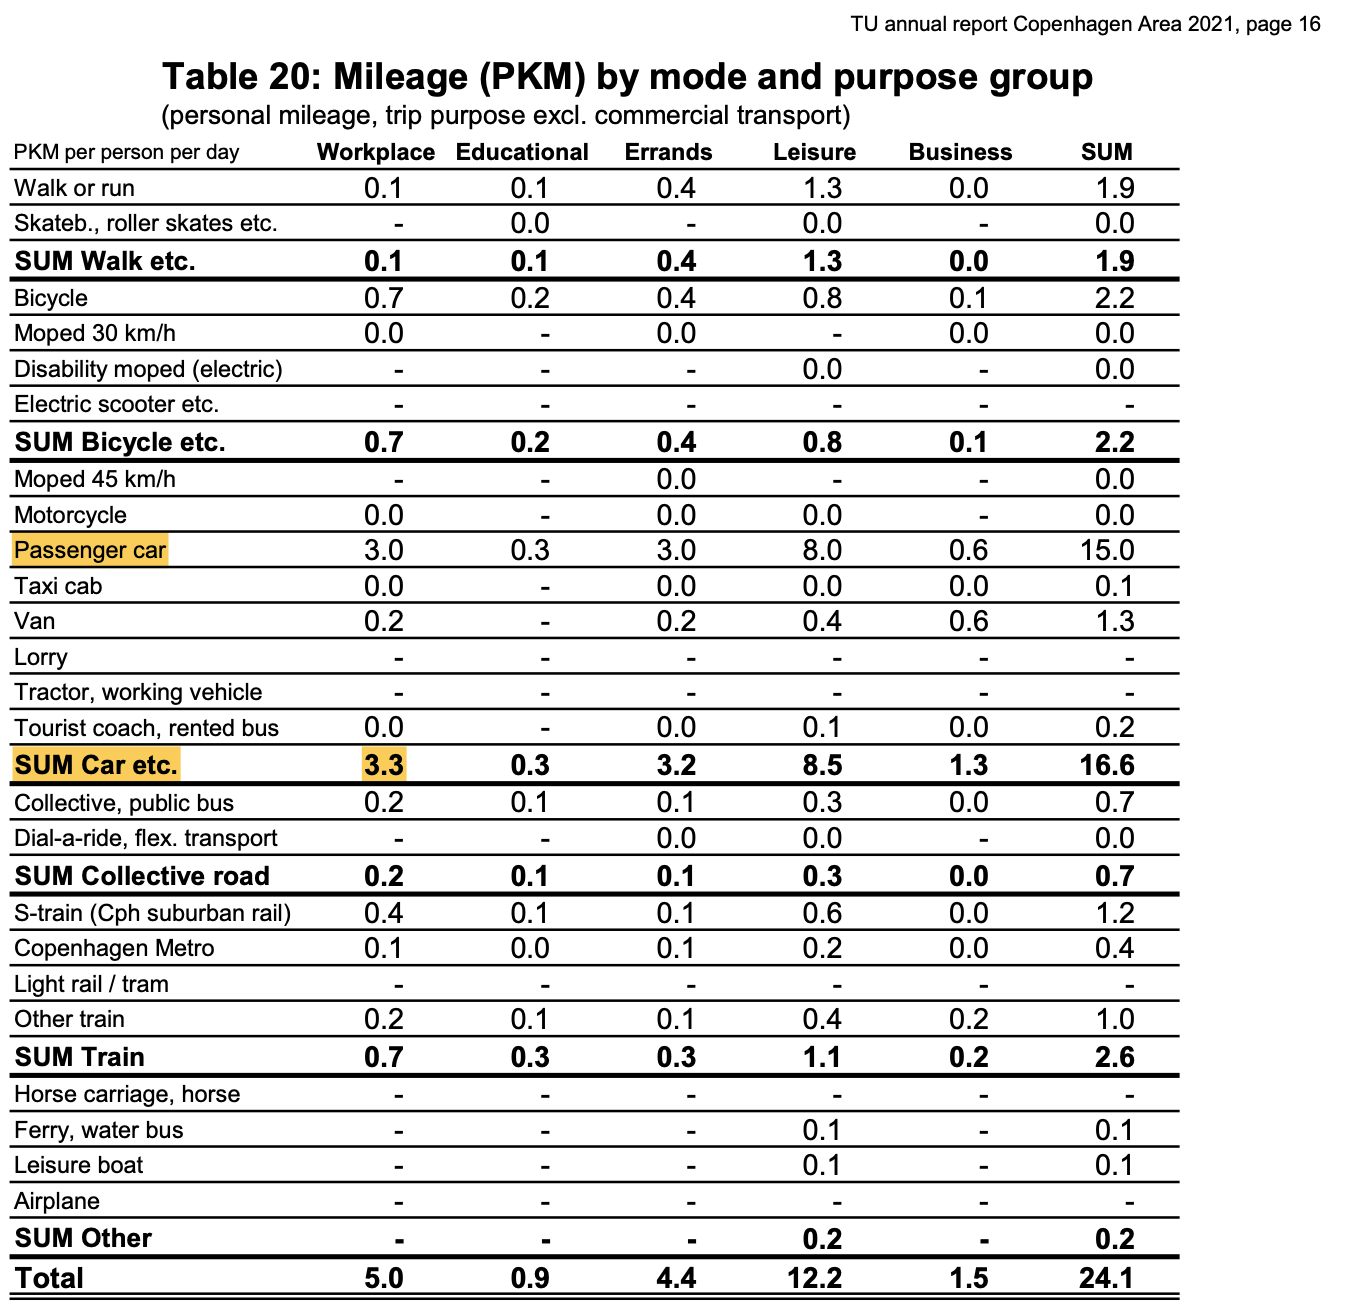
Here’s Table 20, showing a summary of the person-kilometres travelled by people in the city, by distance and mode of travel, in a way that tells us how far people are going by which mode when they commute. When they travel by “Passenger car” to a workplace, they’re usually driving about 3km. Neat!

There’s a bunch more data in the survey to use, but with this sort of data (and to be fully transparent at some stage I hope someone with more statistical expertise than me can verify that yes, this is the right and appropriate way to use this kind of survey data, and ensure we’re pulling the right bits out) we can plug in that average into our estimates for anyone who we know drives to work (perhaps because they told us in the survey but not the distance they travel, or because we have observed it ourselves in a small-to-medium size games business where it’s possible to know most people).
So with a bit of maths, even without self-reported data, we can estimate the average car commuter distance to our Copenhagen office by multiplying the number of trips over a year by the average distance, the days worked from the office in a usual week, and an appropriate passenger car emissions factor. There are a few other little considerations, but that’s essentially it. The maths is largely the same for self-reported km’s as it is for estimates.
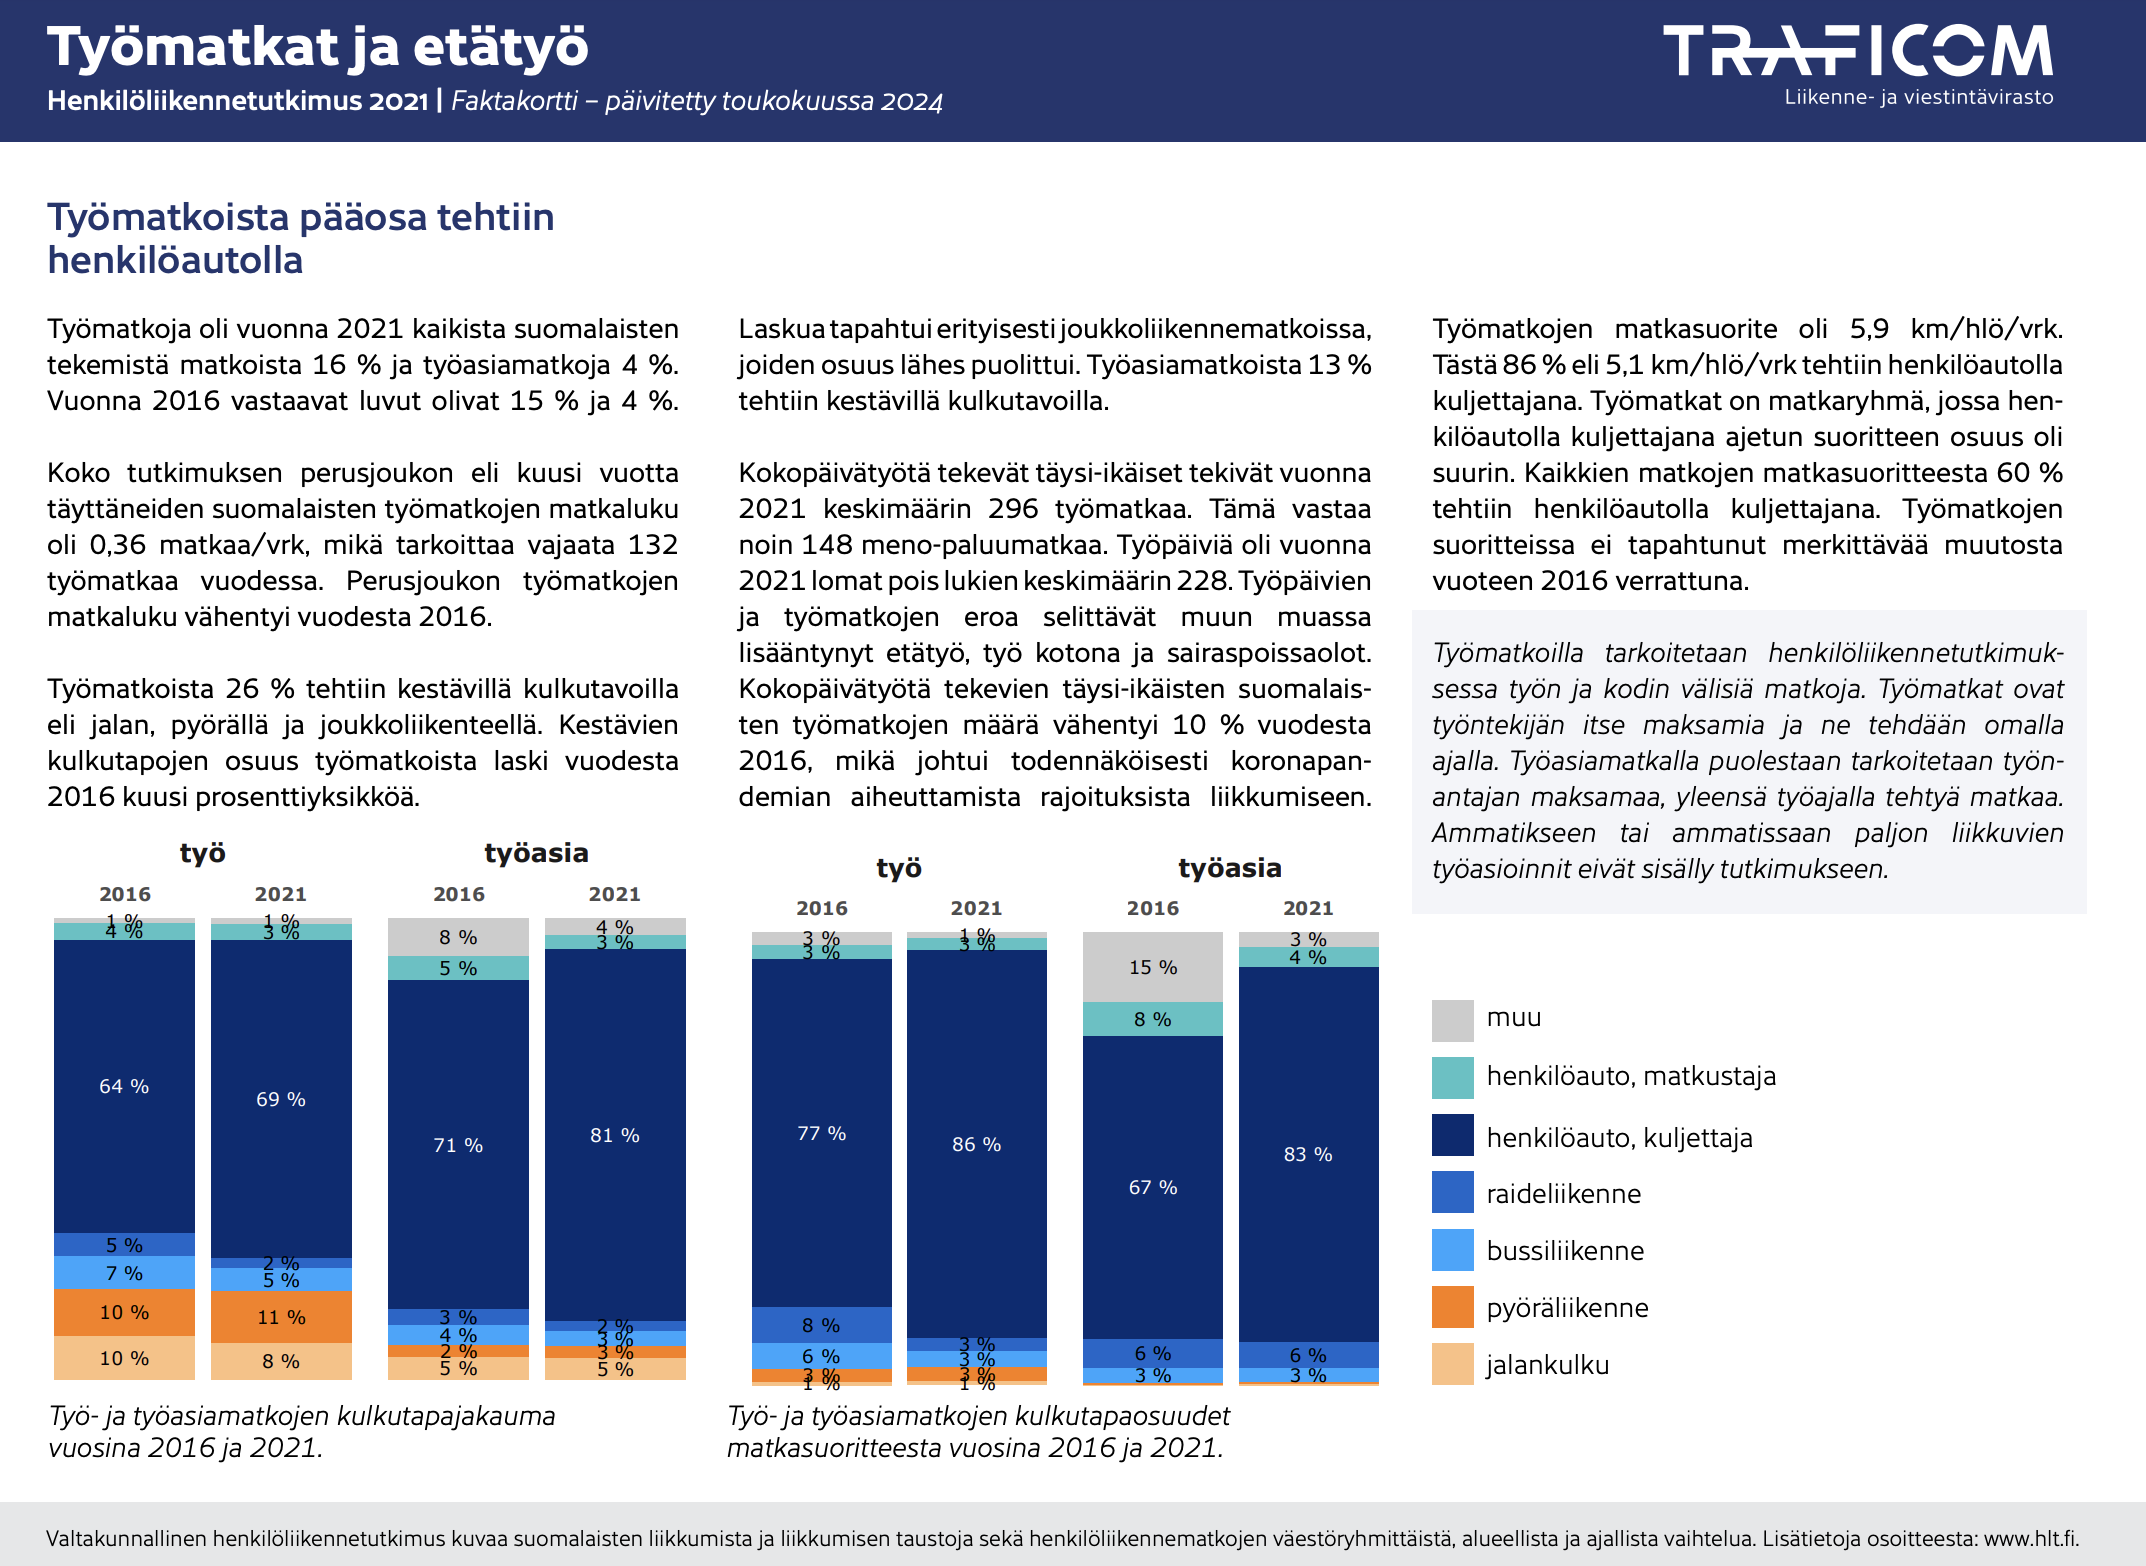
Lots of other cities have these sorts of surveys now, and if you speak Finnish and want to see what’s been going on in Helsinki, you can check out the most recent Traficom survey. [PDF] Thanks to SGA research assistant Petra for digging this and a couple of others up.

According to Google Translate, the first part of this page of the report states the following:
The majority of work trips were made by car. In 2021, work trips accounted for 16% of all trips made by Finns, and business trips accounted for 4%. In 2016, the corresponding figures were 15% and 4%. The number of work trips for the entire study population, i.e. Finns aged six and over, was 0.36 trips/day, which means just under 132 work trips per year. The number of work trips for the population decreased from 2016. 26% of work trips were made by sustainable modes of transport, i.e. on foot, by bicycle and by public transport. The share of sustainable modes of transport in work trips decreased by six percentage points from 2016.
So you can already see the importance of city-specific travel research – and the results of these calculations can help decision-makers understand what sort of impact their business is having. For example: for medium-sized games companies based in Helsinki, you can probably expect your employees to be commuting in the same way as the general population, and so you might conclude “well, only 26% of work trips are made via sustainable transport – let’s try and get that number higher.” And then you get to ask yourself what sort of changes might support that goal. Subsidised public transport, perhaps, or moving the office closer to public transport (at the more extreme end of solutions).
So that’s the thinking about the physical commuting part – and aside from different emissions factors for car, bus, train, etc. the maths in the data spreadsheet are the same.
So for the remainder of the usual employee week, where are they working from? Probably from home, and WFH is an increasingly important part of the "commuting" picture. The Greenhouse Gas Protocol, while clear on physical employee commuting, hasn’t been updated since pre-Covid times, and lacks much in the way of guidance around WFH emissions, which as a practice has massively grown in prevalence.
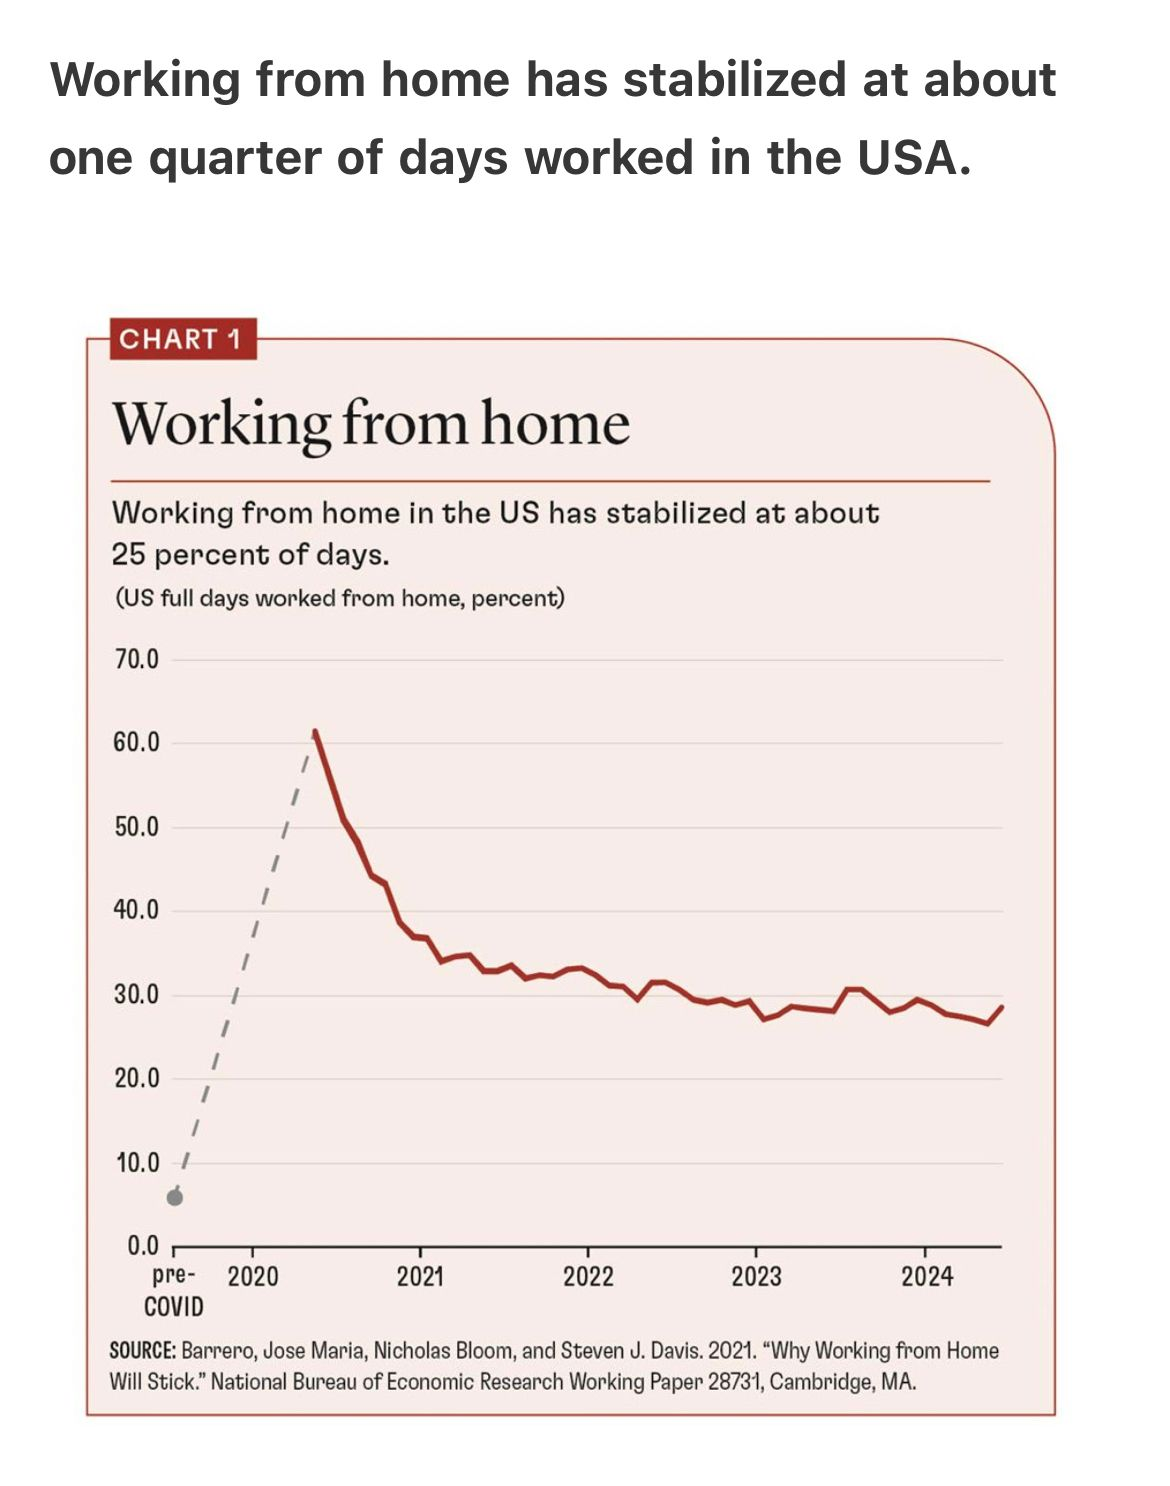
Here’s a recent chart of WFH rates in the US which shows the figure stabilising at a new rate of about 30% (up from <10% pre 2020!). That’s quite the change.

There’s been a few research papers to come out since the covid pandemic, suggesting different approaches to calculating WFH emissions – linked to in the “Resources” section at the end of the standard specification document (FYI this is the “release candidate version” to be folded into the ‘official’ standard docs linked on the SGA website shortly, and still accepting feedback). EcoAct, Lloyds Bank and NatWest Group did one, as did Vodafone and Carbon Trust – both from fairly early on in the pandemic.
Taking these approaches on board, along with feedback that individual countries have government-published work-from-home emissions factors (courtesy of Ubisoft’s Océane Garnier, who pointed us toward the French ADEME figures) we decided that a “simple” emissions factor-based method is necessary as an entry-level option. Here, we take the sum of FTE WFH days across the company and multiply it by the basic inputs that the report preparer inputs (usual number of work days per week, hours worked, weeks in the year, etc) and the published WFH devices emissions factor. You can do these calculations in a matter of minutes, and with minimal data collection effort, but we don’t get much insight about where to focus decarbonisation efforts in this area, so we also want a couple more ‘enhanced’ options.
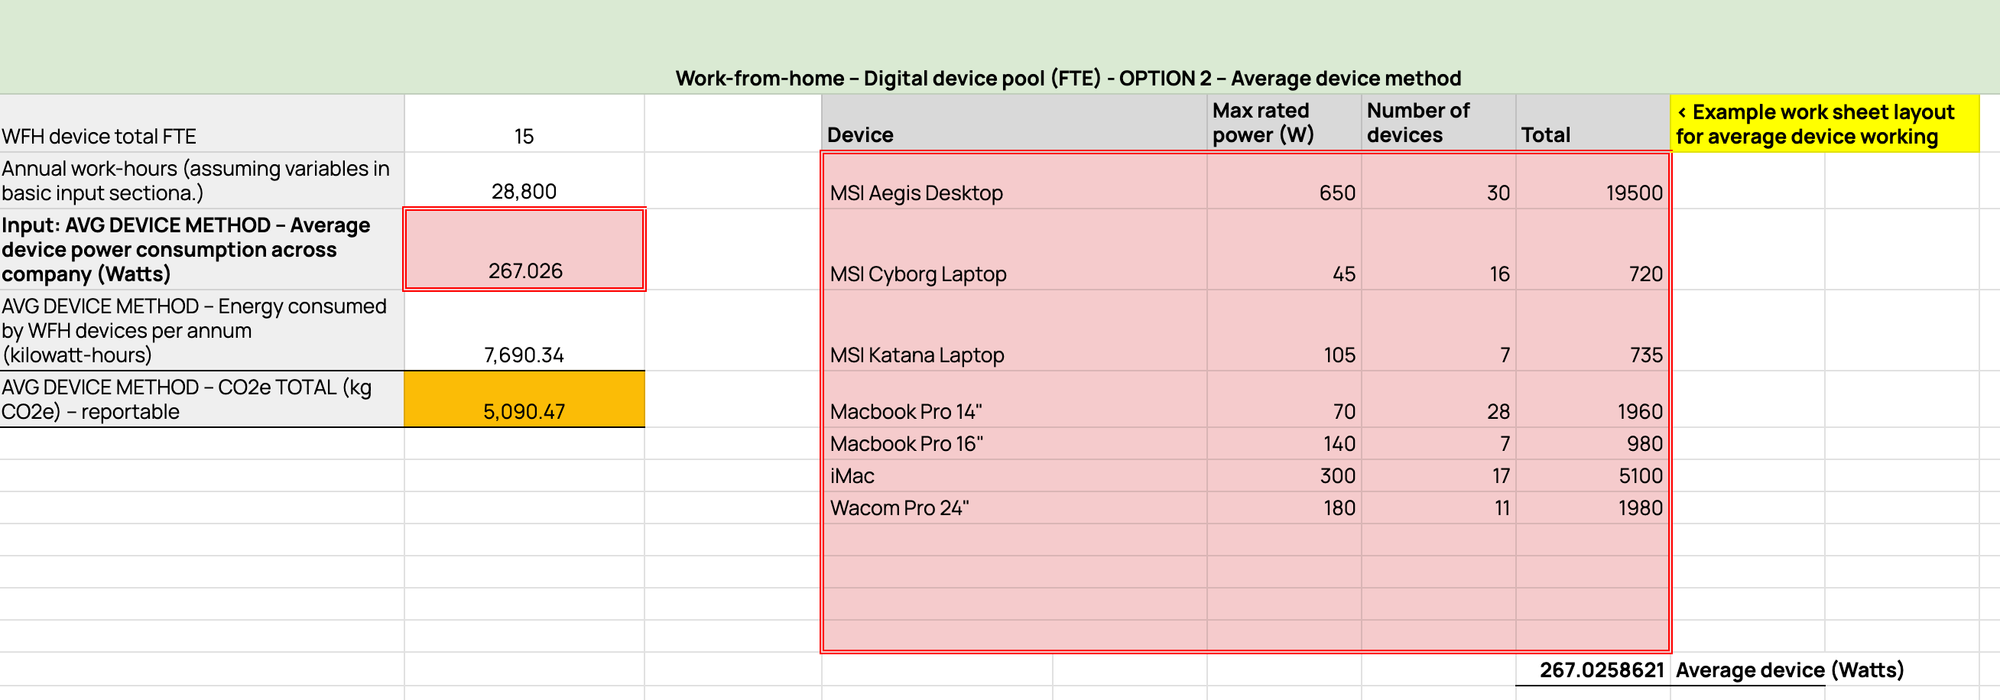
The first of these is an “average device” method, which collects data on the WFH devices supplied to employees (from IT systems, for instance) and produces an average power rating/energy consumption figure for devices across the company. Here’s a screenshot of an example worksheet section that produces an average device energy rating of 267 watts. Shout out to Nelli Aguilera from SGA member org Super Evil Mega Corp (great name) for providing her time and expertise, and helping test and develop this method.

With this device energy rating in hand, we can multiply the same FTE WFH days across the company with the location-specific emissions factor, and get ourselves an emissions total. One caveat is that this assumes all WFH employees are in the same location – and there’s not an easy way to account for different locations without requiring each “location” (i.e. country a worker lives in) to have its own separate sheet and separated FTE totals by country/location. It’s a bit of an awkward solution, but accounting for multiple locations in one equation gets a bit complex. Another caveat is that this method assumes the WFH devices are using 100% of their rated power draw for the entire workday, which is probably not the case – so at some stage, we may want to do some research to validate some assumptions about the typical utilisation factor of game dev devices and add that to the calculations. For instance, I might assume it's about 60-75%, but then I just watched Valve's new 20 year anniversary of Half-Life 2 documentary, and they mentioned using a distributed shader compiling system that ran across the entire office's computers to optimise build times. That might push up that number closer to 100%, but again, that's an edge case. Cool doco though, do recommend!
The benefits of more research bring me to the third and final WFH method, which I think I’m most excited about the potential for. Behind this method is a “role-specific profile” approach – which can be done in one of two ways. First, if all employees in a particular role or job description are issued with the same IT devices to WFH from, then we can already assign a known power profile of that device to those specific roles. Then we just multiply the FTE WFH days, broken down by specific roles, and multiply them with those same basic usual annual hours worked settings as above. The second approach is to draw on the expertise that we will accumulate at the SGA specifically about role-specific WFH energy requirements for different kinds of gamedev. For example, based on the IT data that Nelli collected, we are able to see that Art type roles (so 3D modellers, texture artists, level designers, etc etc) are typically using much, much more powerful devices than, say, Ops or Production team members. This makes intuitive sense to me – if I’m just working with spreadsheets I probably can make do with a light little laptop, but if I’m working on super detailed models with billions of polygons, then I’m probably going to need something beefy with a dedicated graphics card.

We’re not quite there yet, but my dream is to be able to know, based on the research and calculations that our SGA member orgs (and that other researchers can verify or show in their own research findings) what the average power required for a given game dev role looks like in a very concrete way. That may help other devs plug in the numbers and see where they’re using the most energy and emissions. The results might also show other insights – like which teams or locations should be prioritised with policies to support employee renewable energy consumption, or who can be assisted to install solar panels at their house, via concessional loans, for instance.
These are just very initial ideas that come to mind, I’m sure plenty of other opportunities will make themselves known once we start collecting this sort of detailed information, and can start making smart choices about what we encourage, and what we avoid. Another caveat in this whole area of WFH energy & emissions is that none of the methods, at present, account for employee home solar or renewable energy purchases – and I would like them to eventually. More work will be needed to develop simple and reasonable processes to verify those sorts of details. I do know of at least one company, here in Australia, that has already begun paying small subsidies for their employee’s power bill if they can show they purchase renewable power. How neat!
There are also two methods for WFH heating and cooling, though at present only the simple emissions factor-based method is actually working – there’s potential to collect WFH heating or cooling technologies data from employees in future, but technology-specific emissions factors for, say, heat pump heating vs gas heating are pretty hard to come by. We also need to make sure that we're not attributing non-additional energy to WFH – for instance, whether anyone is home or not in deepest darkest winter in Scandinavian countries, the heating stays on to prevent everything freezing over.
There’s also a simple 10 watts added across the total FTE WFH hours to account for a small amount of WFH lighting. But even over large workforces this does not add much – a testament to the effectiveness and energy efficiency of LED lightbulbs, which have improved a huge amount over the last few decades.
So that’s the methodology we’ve settled on so far for employee commuting and working-from-home energy and emissions. I'm very keen to hear what you think, and always open to suggestions and improvements. Remember, the SGA standard is a living standard and each and every component of it is open to debate and discussion and will receive regular revision and updates as knowledge and technology improves. Version control is something we’re trying to be quite conscious about as well with the standard and spreadsheets, so you should always know which version or revision you’re working with. More to do on that still.
In the meantime, if you want to give the method (and our spreadsheet) a stress test, here’s the release candidate of the data input sheet. Any and all feedback will be gratefully received – particularly if anyone feels like checking the maths in my equations. As a rule, there's almost guaranteed to be at least one error hiding somewhere.
And here’s the detailed written specification documentation – which explains when we think each of the methods can be reasonably used. i.e. to avoid fudging and picking a ‘lower’, less accurate number, for instance, and why. One of the major weaknesses of the GHG Protocol is that by needing to be all things to all types of companies, it leaves a lot of room for interpretation and we really want that to change. If it seems prescriptive about methods and eligibility, well, that’s sort of the point. So that's critical too, if you have feedback on what seems appropriate or not.
Will it work for all game companies, everywhere in the entire world? Well, that’s what we want to find out! So please try it, and see if you run into issues with your particular circumstance. The SGA standard lives or dies based on whether or not it actually gets used and provides actionable insight for the games industry, so don’t be shy. Let me know if you run into trouble. I’ll be recording a short demonstration video next week to show how it’s designed to be used, which I’ll share when it’s available. We’re also working on an example draft survey for companies to use that will collect all the data needed for these methodologies (and perhaps others as well).
Also, join the SGA! I think we're really on track to make a huge, huge difference to the games industry's emissions. Reach out and find out more, and what we can work together on.
Thanks for reading and for sticking with Greening the Games Industry as I adjust to the new routine of (roughly) monthly posting – GTG Links will be a bit more frequent than that (depending on the pace of news and other things). Big posts like this one that take a lot of time are probably going to be a little bit sparse for now. Just managed to squeak this one out before the end of November.