How much electricity do gamers use annually? – Can we put a number on the footprint of the games industry, Part 4


This year I’ve been revisiting the very rough early estimates I made in the process of writing Digital Games After Climate Change – trying to come up with a number for the total emissions footprint of the global games industry. There’s a new report out by Activate Consulting (spotted via a recent Game Discover Co newsletter) which has some interesting statistics on how long gamers play for, alongside wider media consumption habits. I think it’s an interesting starting point for another set of estimates, because it provides us with a good way to guesstimate how long players actually play games for.
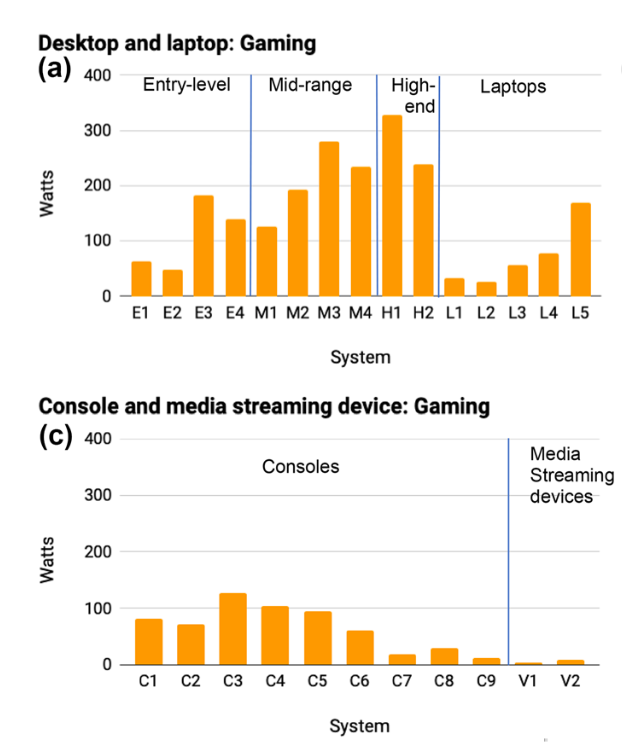
That’s a major piece of the puzzle that we’ve been missing, as it is a major factor in determining the footprint of end users (gamers) – as Mills et al (2019) pointed out: “user behavior (duty cycle, game choice, settings) is a stronger driver of unit energy consumption than technology choice.” The were findings from one of, if not the most detailed and intensive studies of different gaming hardware energy usage. Here’s their chart for the twenty six (!!) different hardware configurations they tested, and the average of all the tests they performed on each.
But coming back to the new report, Activate Consulting surveyed over 4,000 people (which is a huge sample), and broke the gaming audience down into three categories: super gamers, avid gamers, and casual gamers, with some pretty impressive numbers.
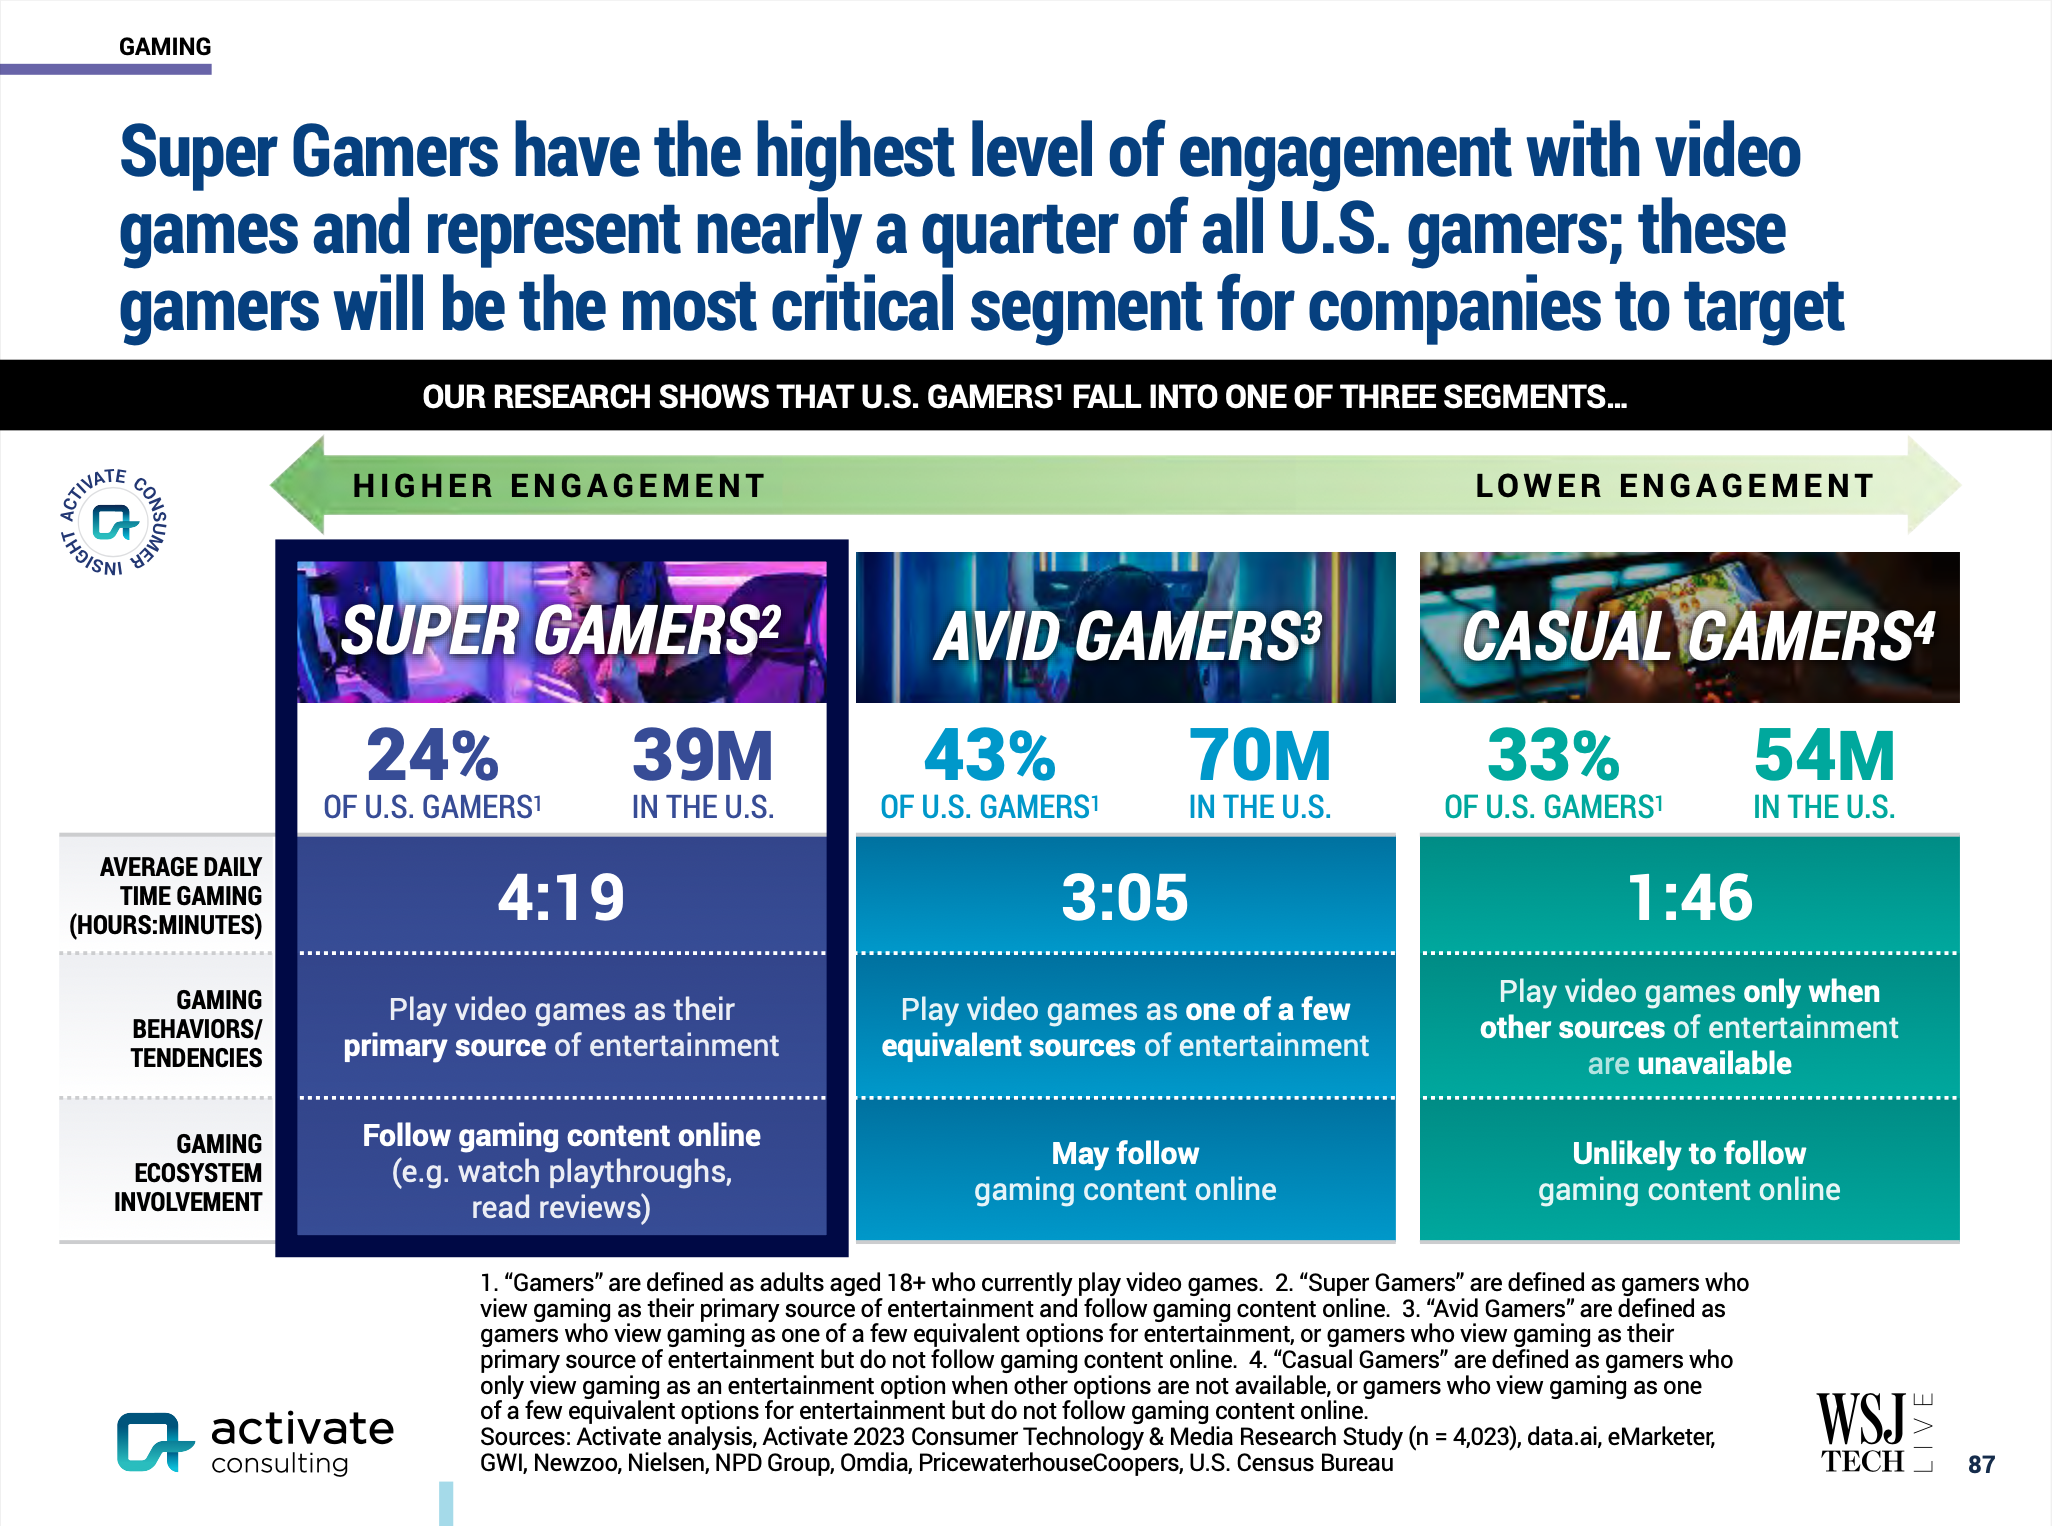
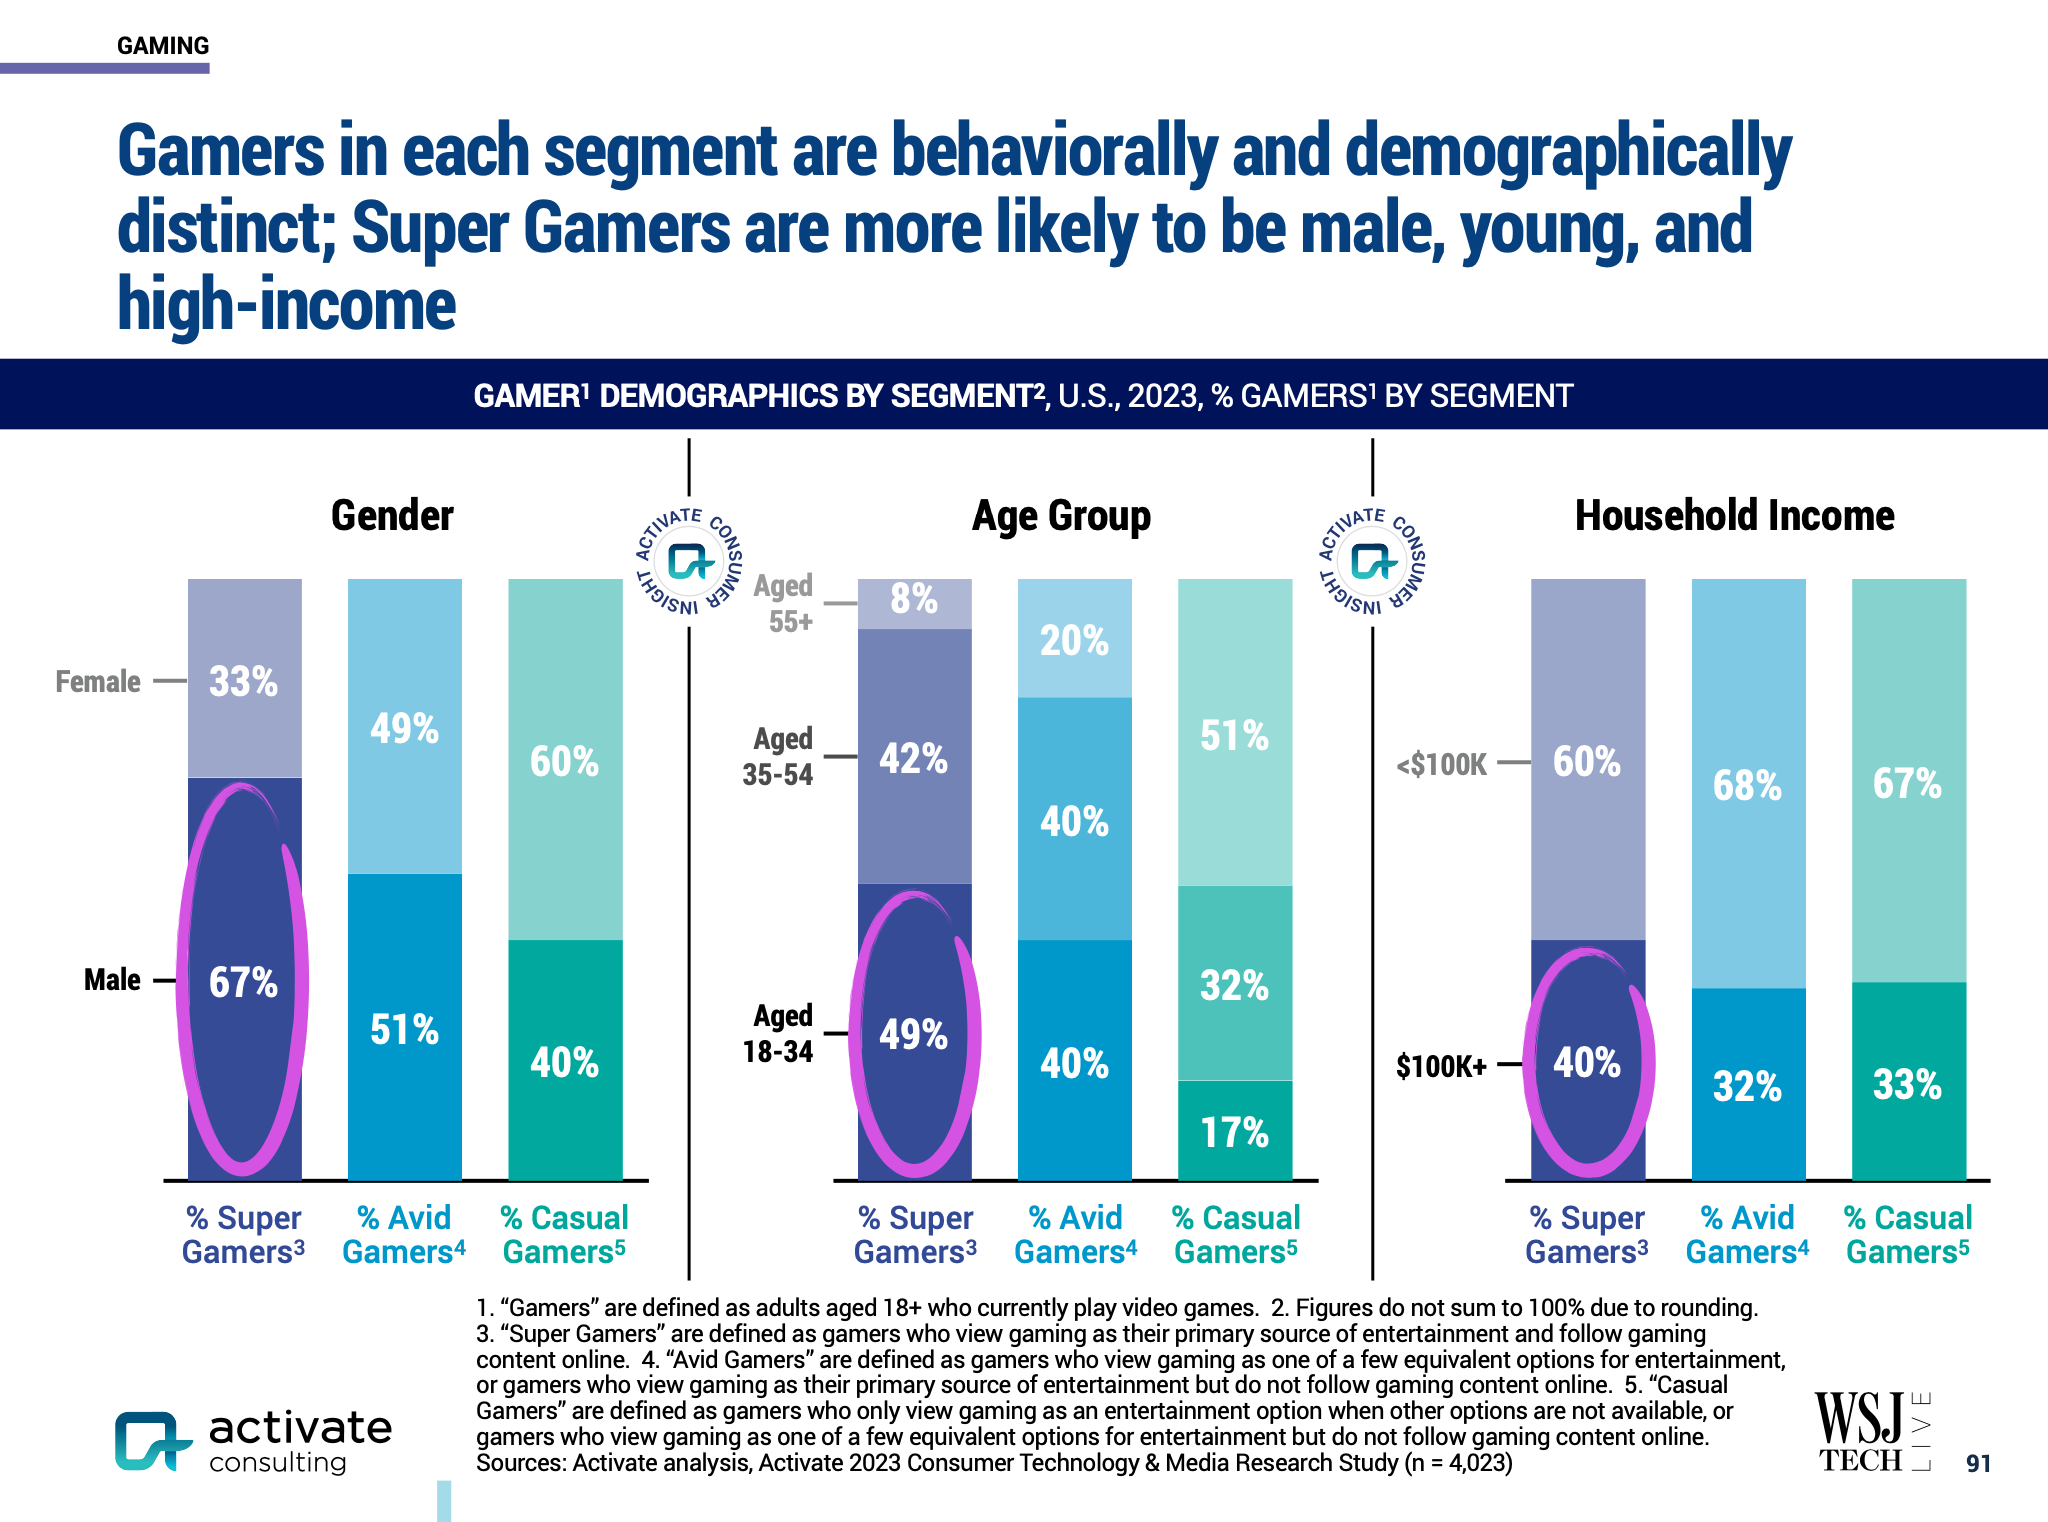
Four hours a day seems like a lot, but these so-called super gamers (who we might be tempted to think of as ‘core gamers’?) are also more likely to be Male, 18-34, and on above average incomes – which makes 4 hours per day seem… plausible?
So the other thing we need in order to make some educated guesses about footprints is what platforms they’re playing on. Even though Mills et al’s point above, the platforms chosen do have different energy profiles. However, there doesn’t seem to be a simple or straightforward answer to that. In fact, the answer seems to be that more people are playing across “all of them” – or at least, across multiple platforms?
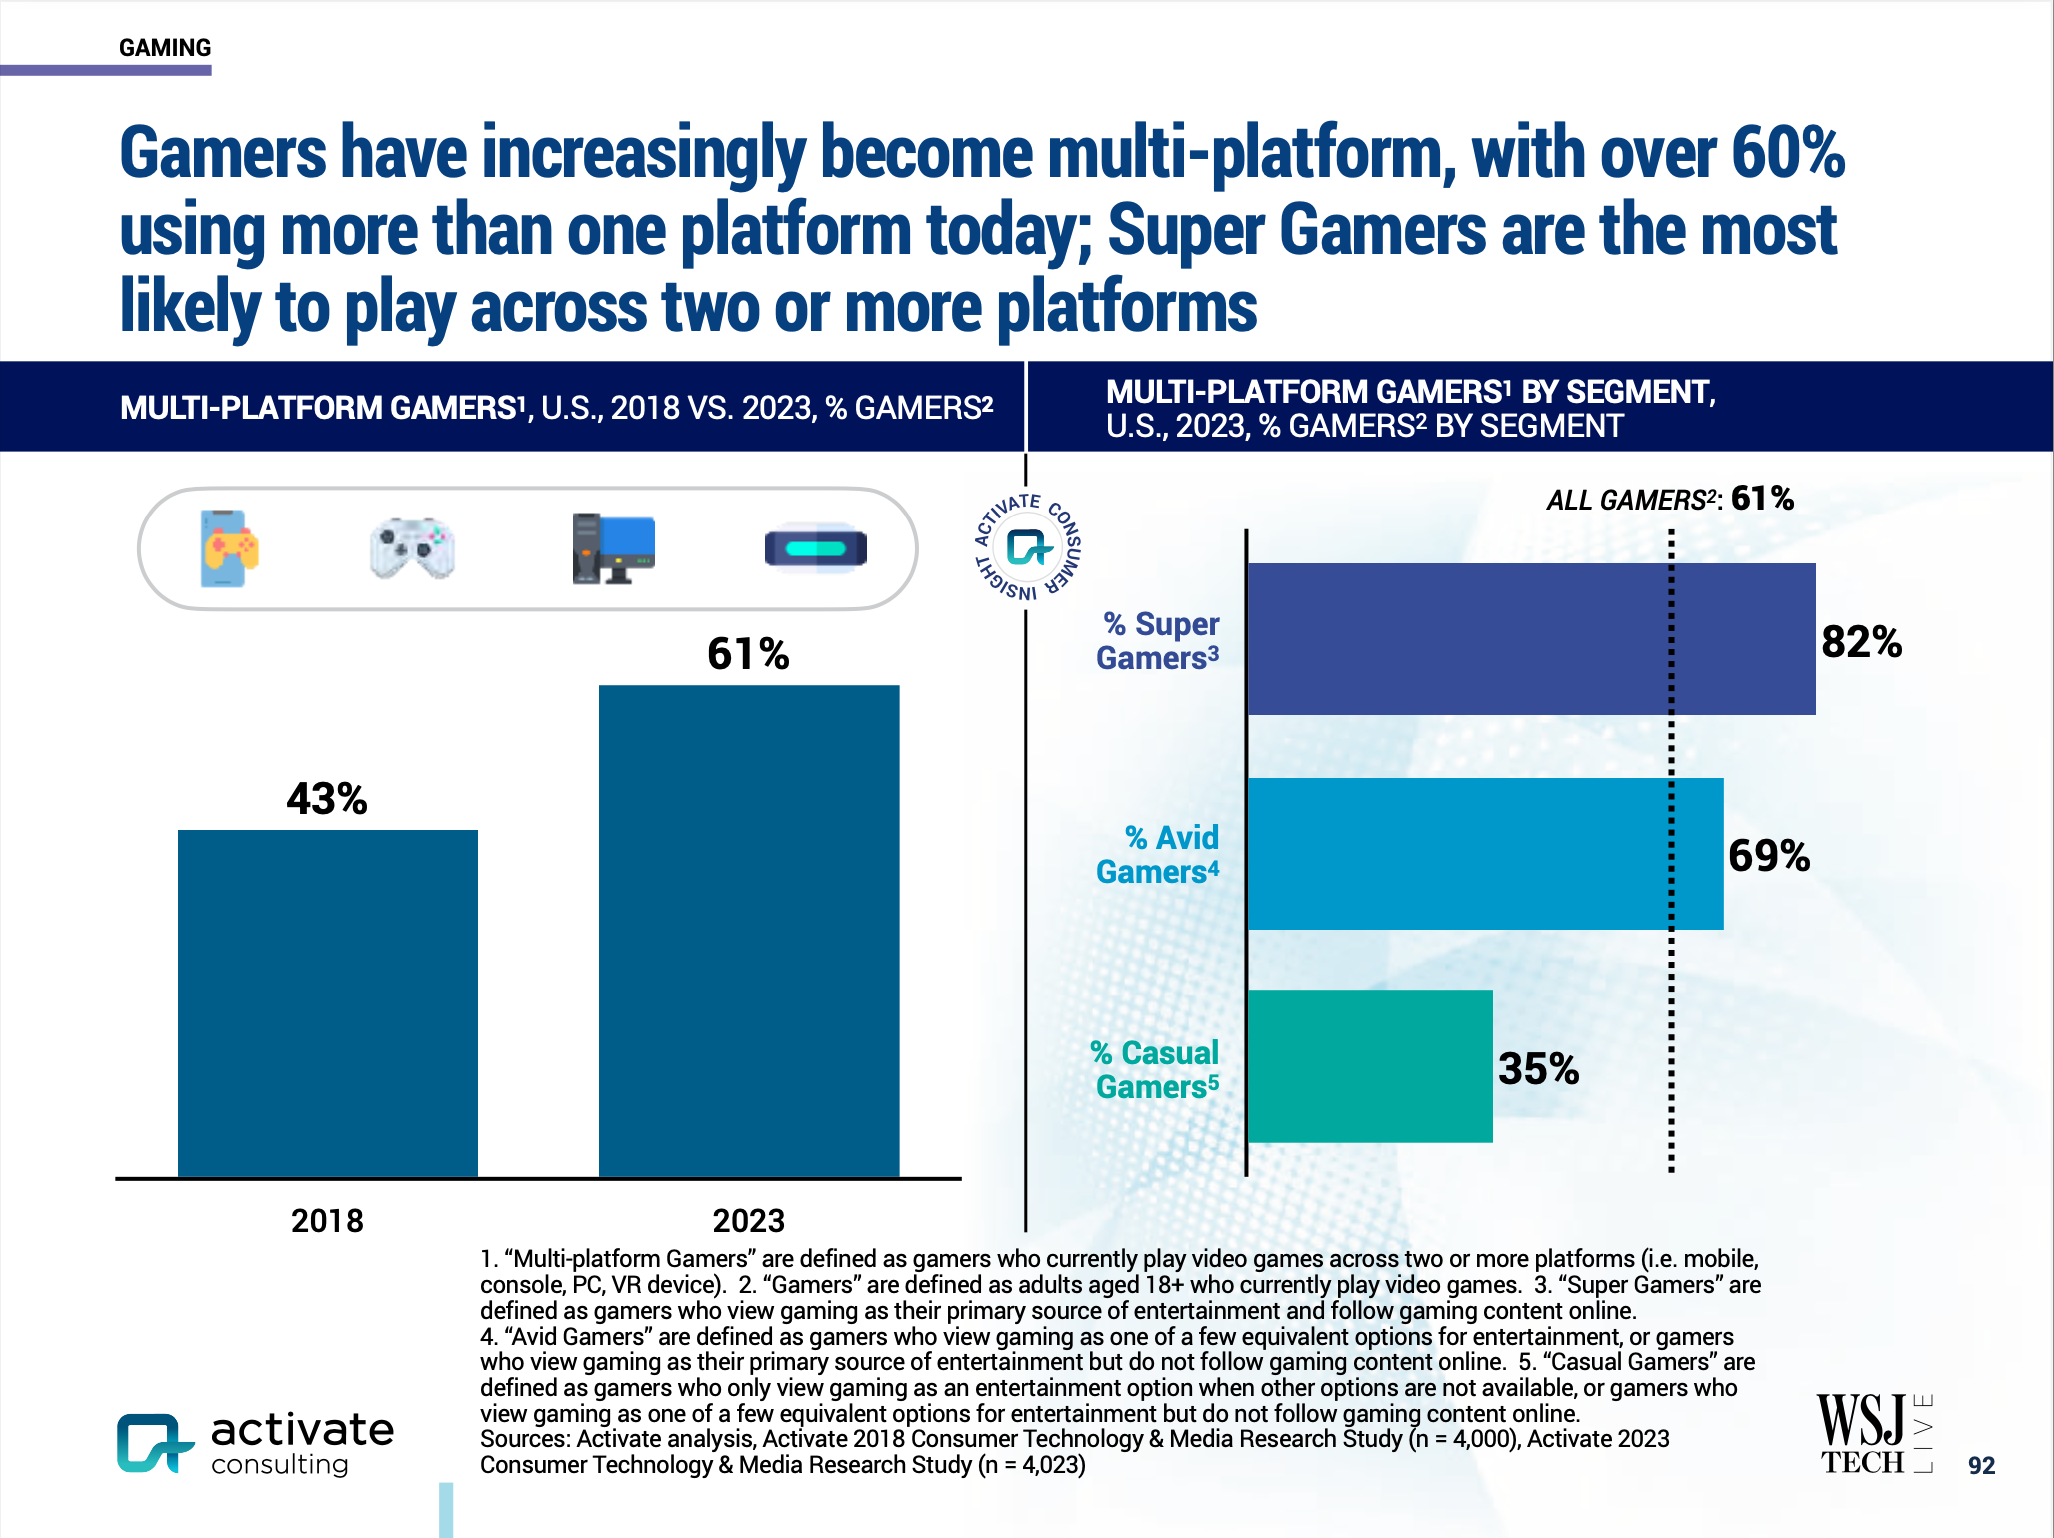
In one sense, this might be good – my assumption is that super gamers will tend to also be the ones who gravitate towards higher energy platforms: mid and high end PCs (from Mills et al.’s chart above) or higher powered consoles (PS5/Xbox Series over the Nintendo Switch or mobile). So diversifying could lead to lower average power consumption – but only if it’s shifting away from even higher power PCs. But this is 100% an assumption, and it could be wrong. I have no evidence for it one way or the other.
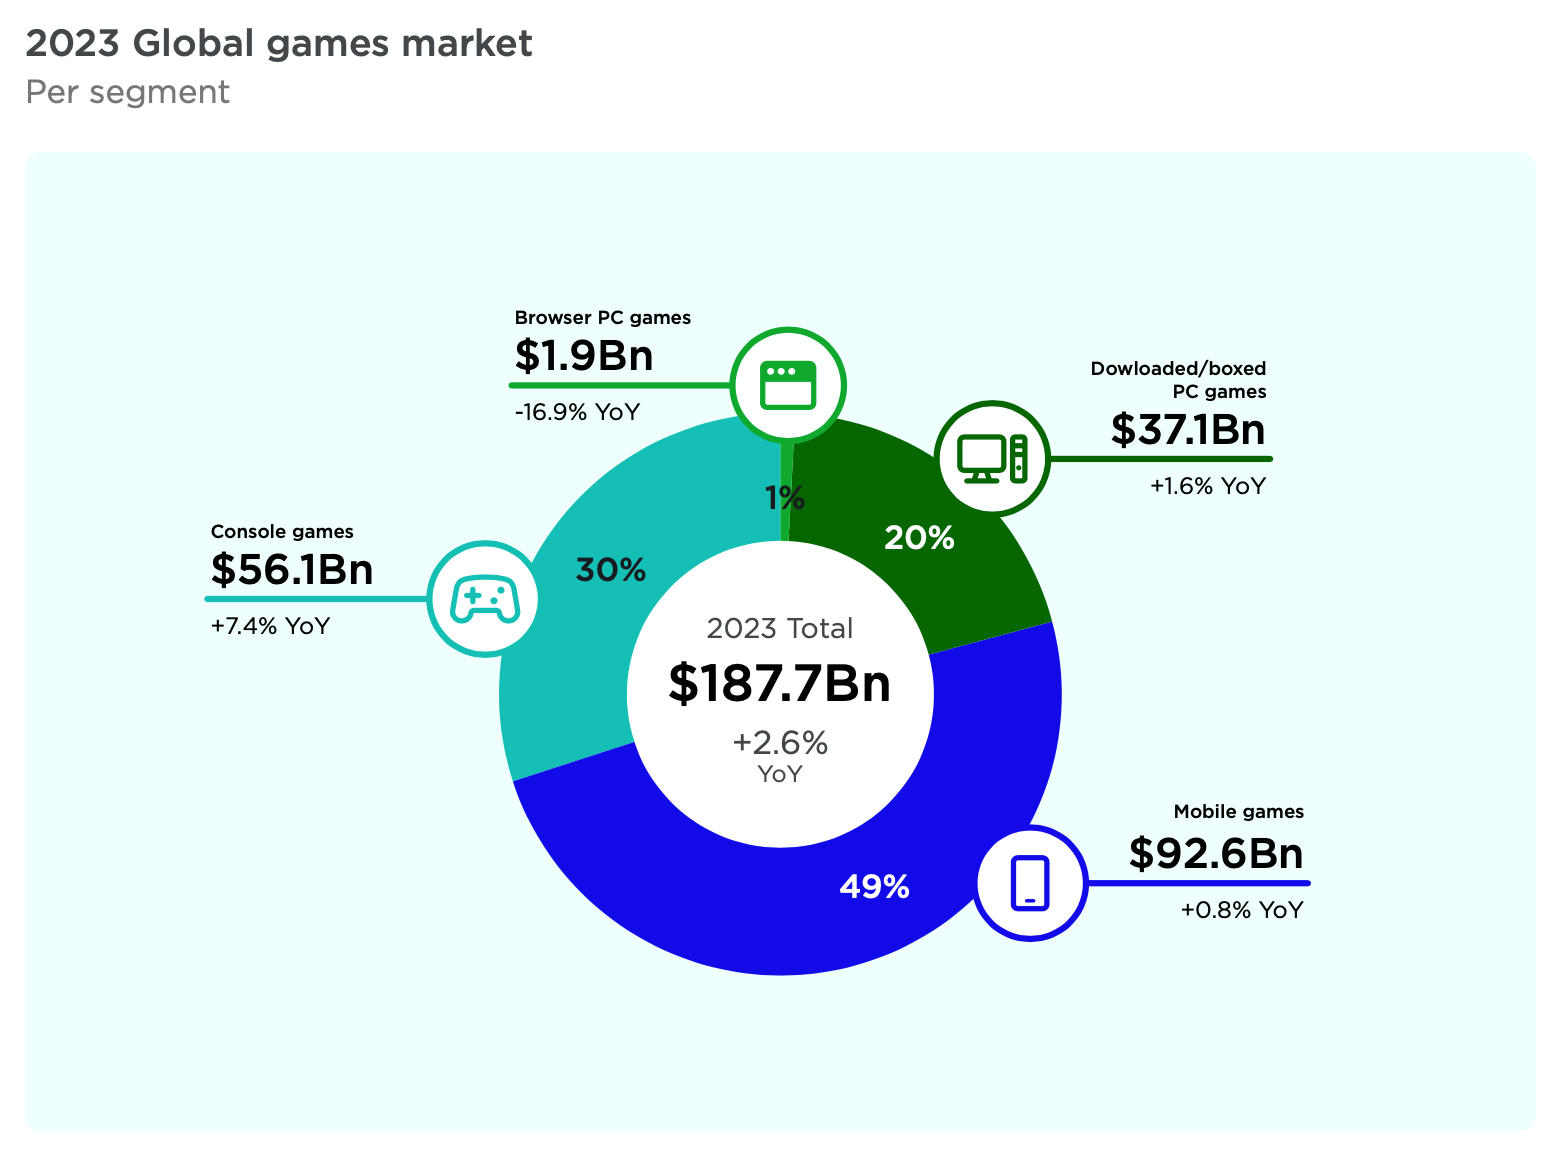
One other indicator might be the revenue growth of each segment – which Newzoo reported on in their annual report earlier this year. While the PC game market only grew 1.6% over the last year, console grew 7.4% – and the relative size of the two markets 20% of overall market for PC, 30% for console, might be a decent indicator of the split as well though I’m sure it’s more complicated than that.
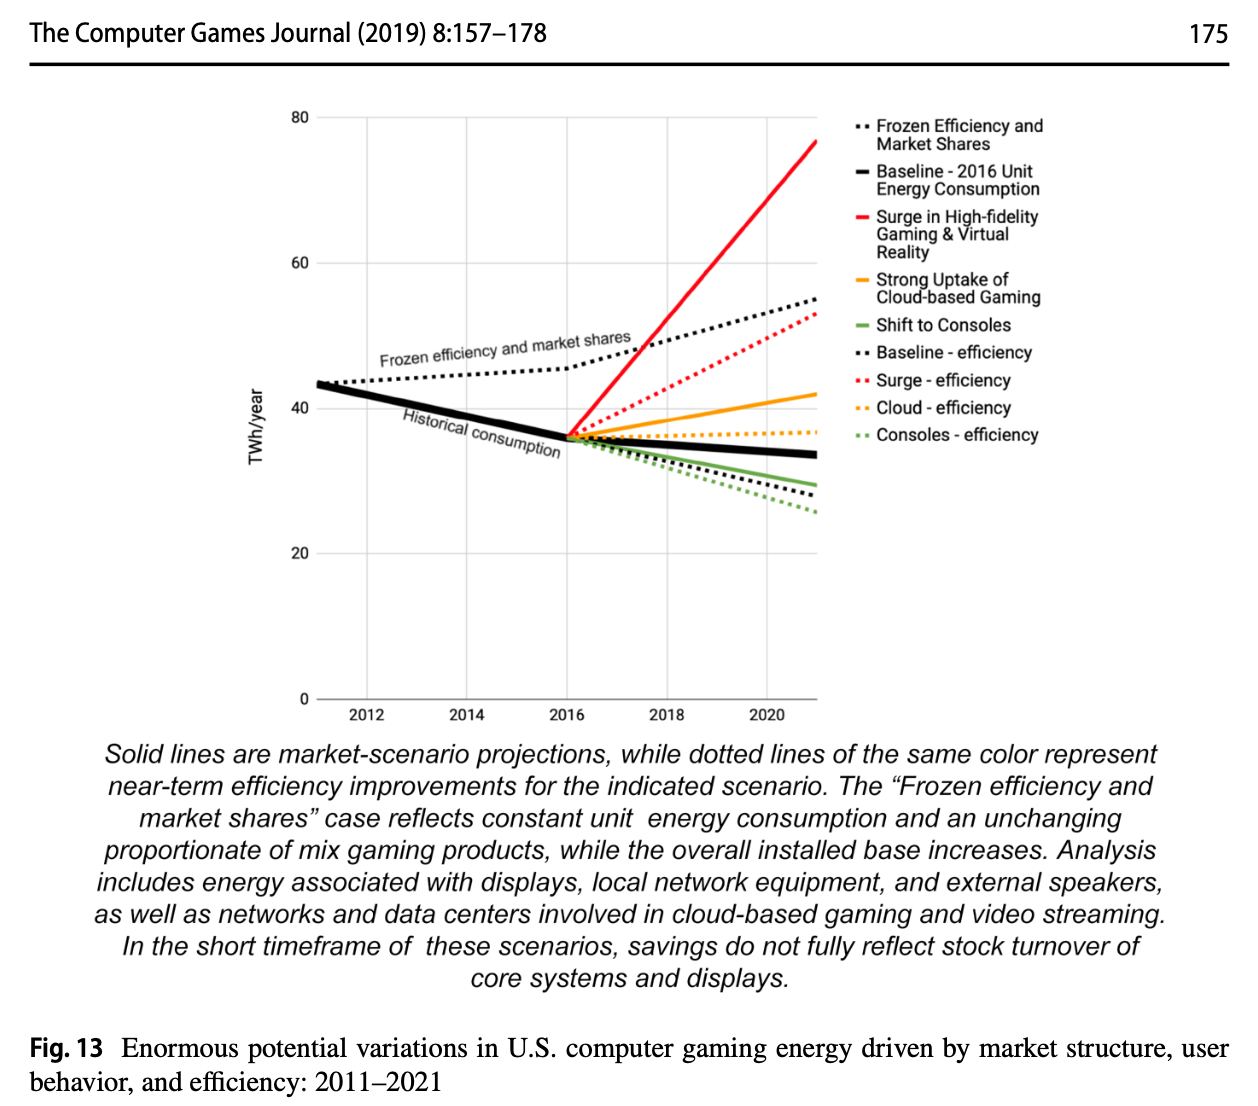
In their paper, Mills et al. (2019) estimated that all game devices in the US consumed as much as 34 TWh of electricity in 2016, with associated emissions of 24 MT CO2e per annum. They modelled the effect of a number of scenarios on overall consumption if, for instance, we saw a boom in graphics intense VR applications (which doesn’t seem to have eventuated, imo), or widespread uptake of cloud based gaming (same – rip Stadia), or a ‘shift to consoles’. This last one looks the most like the scenario the Activate Consulting report seems to be describing, in which case it looks like its just over 30 TWh.
So can we do anything else to tentatively confirm this figure? If we can pick (plausible) average energy usage estimates for our three gamer groups (based on the “shift to console” aka “multiplatform” scenario) then maybe we can combine that with the hours-played-per-day figure and get something close.
There’s one elephant in the room however, which I haven’t touched on yet, and that is the fact that current gen consoles use substantially more power than previous gen. In GTG Links no 34 I linked to a teardown and some testing of the new PS5 slim, and LTT found that there wasn’t any substantial reduction in average power consumption (jump to the 14min mark). The much smaller PS5 slim is still using over 220 watts during gaming, rather than the PS4’s 170ish (or less).

Time for another spreadsheet – actually, an update to an older one. I’ve added a new tab to the sheet I previously used to calculate some very rough estimates for 6 months of Gamepass gaming energy & emissions. On the new tab, I’ve give each of the three categories of gamer (Super, Avid, Casual) a ‘high’ and a ‘low’ average power use figure. These figures are entirely unscientific, they’re just my best guess for what the average energy use might be across all the multiple devices that each group plays on.
The high scenario is less than the highest it might be, but I’m assuming that the multiplatform shift is real and results in a lower average energy consumption even as hardware (from 4080s to PS5s) generally has increased in power since 2016. The low scenario is about the lowest I think it could possibly feasibly be in each case. Again, this is just my opinion, I could be well off.
But the results are interesting, even as a thought experiment. The ‘high’ scenario, once we calculate for all three groups results in a reasonably similar result to Mills et al.’s (2019) estimates. A high scenario electricity consumption figure of around 27 TWh, and a low scenario figure of 14.7 TWh (which is almost certainly way too low – there’s no way the total amount of US gamer energy consumption has halved in the 7 years since Mills et al’s study).
So what’s it all mean? Well, the US average emissions factor is 368.1 grams per kWh, which produces a range of emissions for the two scenarios of as much as 9.9 million tonnes CO2e down to 5.4 million. That’s actually not far below what I estimate the upstream emissions of the global game development to be.
Can we extrapolate to the entire world’s players from this? Not easily, or with any real certainty. But since we’re already up estaimte creek without a paddle anyway, according to Newzoo, the North American gaming market is about 7% of the global total (though there’s definitely some disagreement between Action Consulting’s 163m estimate for the US gaming population, and Newzoo’s 237m for all North America – Mexico/Canda maybe?).
If we imagined the whole world’s gaming population was the same as the entire US (and thank god its not!) then that gives us a very very rough figure of about 210-285 TWh per annum of global electricity used by gamers. That’s probably too high, as we know that other regions have a very different hardware usage and game playing habits, for instance, far more mobile gaming and entry-level PC gaming happens in Asia, older consoles hang around in use for longer in Latin America and Brazil – maybe only Western Europe would be truly a close to matching the US.
Still, if the world did adopt the US’ gaming habits, what percentage of overall electricity would that use? Ember’s electricity data suggests that total world demand for electricity in 2022 was 28,660.91 TWh. That puts the high scenario at 0.994% of all electricity used in 2022. There’s no way that global gamers used nearly 1% of all global electricity in 2022… is there??? Take this big scary number with an truly sickening heaping of salt, but it’s food for thought – it’s certainly worth trying to avoid in any case.
What else have we learned? Despite all the caveats above, I think it does help to know some of the scale of gaming’s potential and existing impact. It’s also nice to have another data point (or the ability to generate data points of your own – just copy the sheet, and tweak the assumed average energy values for the three audiences!). It provides some more weight to the particular scenario that Mills et al. outlined in their paper too – see the ‘shift to consoles’ scenario in the graph below.
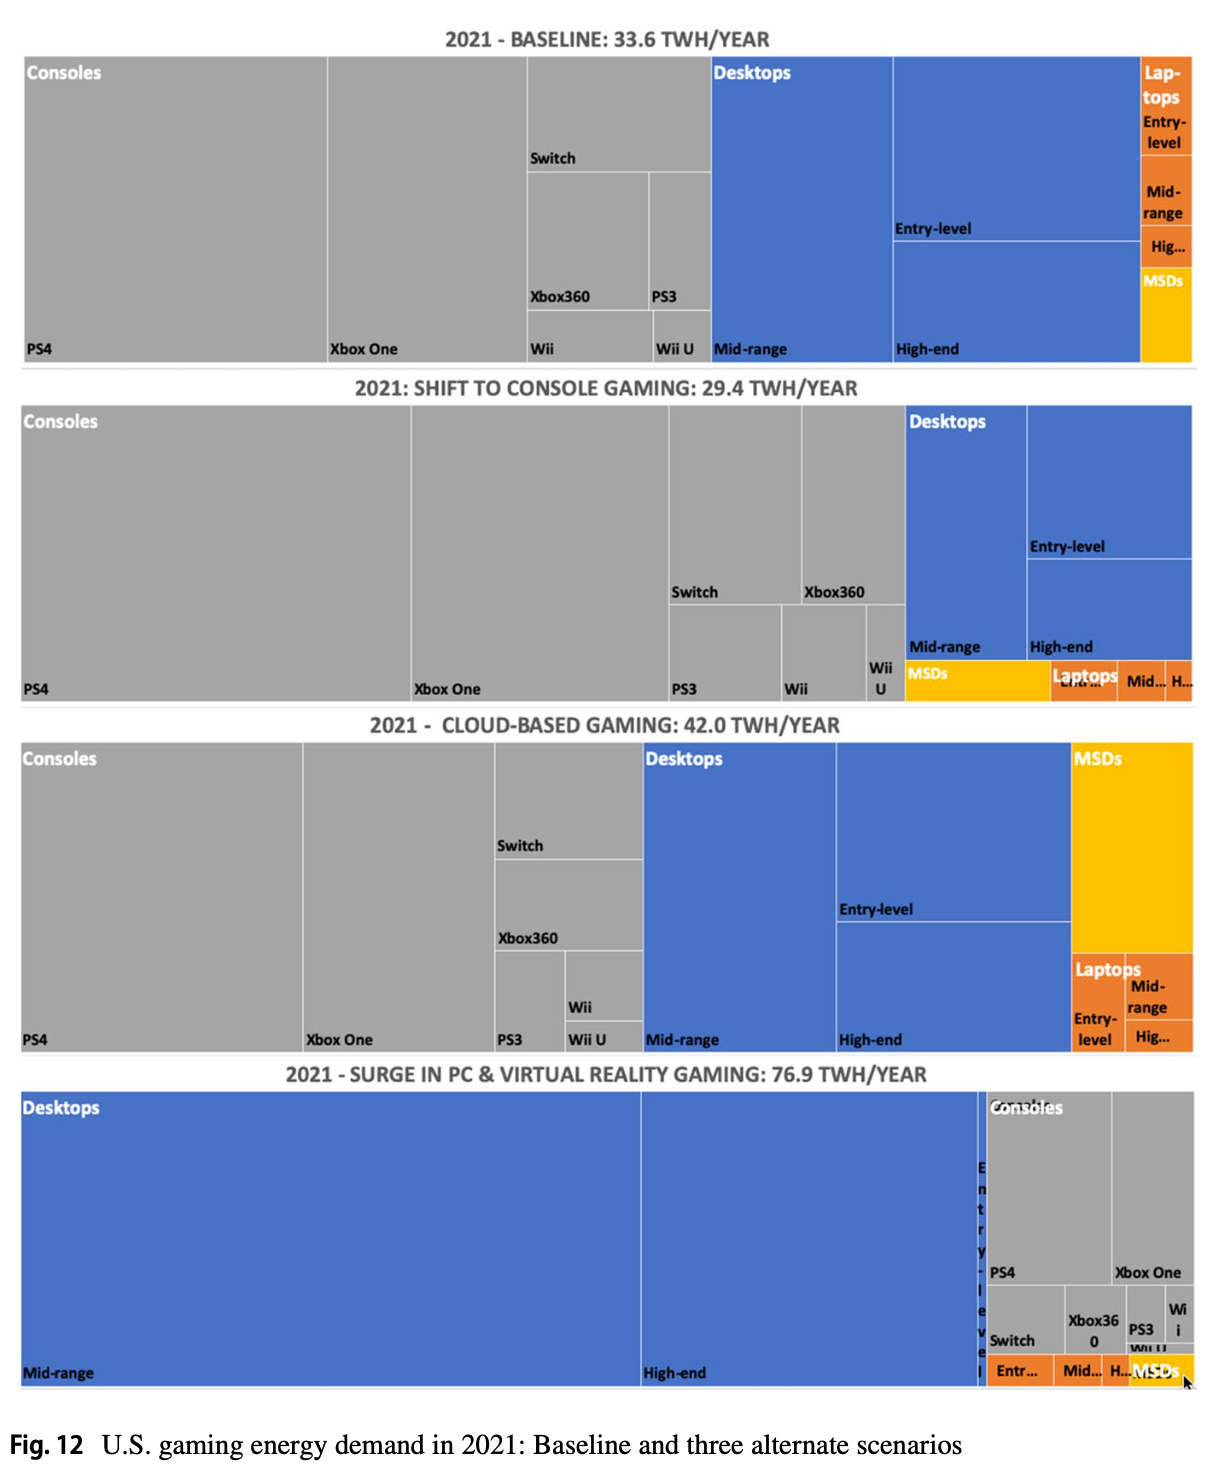
Their description of this scenario most closely matches what I’ve seen happen in the wider gaming industry, and so probably reflects the end-user footprint changes as well. They describe the features of this scenario as “Consoles become the largest segment of electricity use, but in the context of lower combined demand across all gaming activity. Efficiency options could reduce demand by 28%.” I suspect this is probably a fairly accurate summary of the past 7 years, and adds more weight to the importance of console based energy efficiency.
In light of this, it’s perhaps even more disappointing that the engineers at Sony haven’t found a way to bring down the PS5 slim’s power use during active gaming. Perhaps they’ve been working on reducing embedded energy instead? Almost certainly the smaller, slimmer PS5 helps there, using less materials and emissions in shipping. But it would be useful to see a full lifecycle assessment (LCA) of the new SKU, for sure.
I saved a picture to my desktop of a (possibly leaked?) slide about a forthcoming Xbox Series X hardware revision with improved energy efficiency – I don’t have access to that computer right now, and I haven’t seen any more details since. But Microsoft have done us all a huge favour with their work on identifying wasted energy in gaming menus and pause screens. We now know that game developers have some power over the energy intensity of their games. It’s high time to start applying that knowledge.