Can we put a number on the game industry’s annual GHG impact? Part 2 – Disc & Digital Distribution


In the previous post in this series, I outlined a very rough guesstimate of the game industry’s annual CO2 emissions from making games, including all related up-stream value chain activities. Before we get to the real meat and potatoes of downstream use of sold products (i.e. playing games) and the emissions from all the gamers in the world, games first have to get their way into players hands, onto their phones, consoles or PCs. That involves a part of the value chain downstream from game companies, an interface with logistics, trucking, shipping, flying as well as the global internet infrastructure used to download game data.
Below i’ve added some annotations to one of the worst diagrams you’ll ever see, and which comes directly from the GHG Protocol standard. It’s meant to explain the different emissions sources for companies, and what scope they fall into. Honestly a list would probably be clearer.
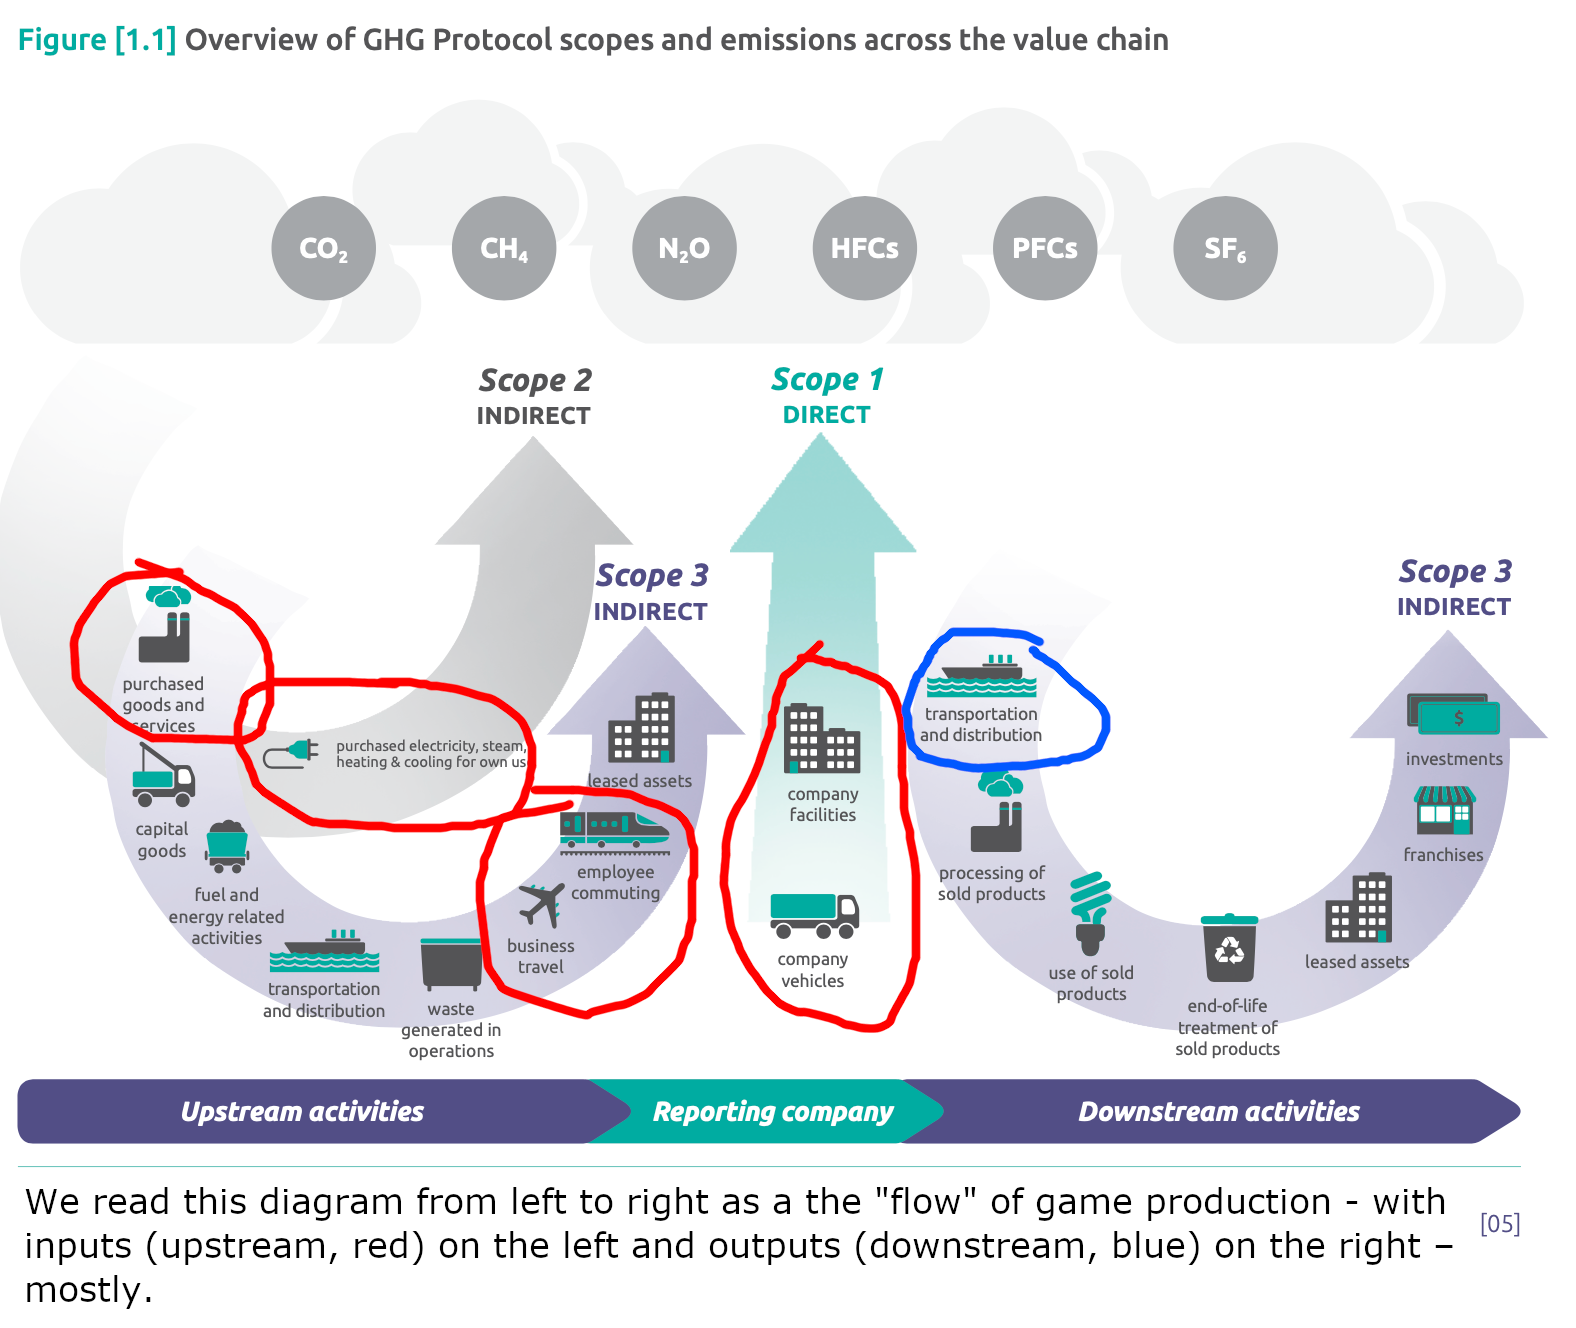
Last time we looked at all the parts of game production circled in red. This time we’re looking at the part circled in blue. Lots of categories will remain uncircled because they don't often appear in game industry GHG inventories, today we're focussong on the “downstream” part of the value chain on the right hand side.
Before we get into the details, we need to talk about cloud streaming because they do away with the tradition sense of distribution and there's some talk of them replacing traditional gaming. These services, like Google’s now defunct Stadia, Microsoft’s cloud gaming service as part of Game Pass Ultimate, and Nvidia’s GeForce NOW, I suspect aren’t yet a big percentage of the overall games industry though. And I’m yet to be convinced that they will be, at least as a straightforward replacement for gaming on a local devices. What cloud gaming seems to be doing is opening up new times and places (like mobile, commuting, etc) to more traditional game experiences.
A more compelling argument for the future of streaming is some kind of blended approach. A couple of Deloitte researchers published an article in Dec 2021 wth forecasts for the future of the at-home games console. They touched on the future of home consoles vs cloud streaming and predicted that: “cloud gaming has been expected to usurp the console, but its threat level is likely to be meek in 2022. In part, this is due to network readiness: This year, most homes globally will lack the required connectivity to run high-performance cloud gaming while sustaining other home broadband needs. ... For cloud gaming to take off, it will likely need to clearly offer better value than the console—such as delivering on the promise of much larger and richer game worlds capable of hosting thousands of players in the same instance.” The same article also suggests a future that involves more than a simple replacement: “The best way for the console ecosystem to compete may be to meld the best elements of the console, which is essentially a high-performance edge computing device, with the best of the cloud.” We'll see I guess.
In any case, I haven’t seen much other data on the scale of the success of these products (nor any first hand experience) so I’m mostly going to put them to one side for this post. For now, let’s just try and put some numbers on the very traditional business of making, shipping and selling games on plastic discs first, and as digital downloads to a gaming device second.
Existing studies of distribution emissions
There have been three main studies on the carbon emissions associated with game distribution, typically comparing the distribution of plastic discs and digital downloads, with the most recent also looking at the emissions of game streaming services. The first publication was Mayers et al.’s (2015) study, looking at PS3 discs made and sent to the UK, using data collected in 2010. Its lead author, Kieren Mayers, at the times was (and remains) a high-level sustainability executive at Sony, and data collection was done directly at Sony facilities. The study focussed on emissions from the production and transport of discs compared to digital downloads, and produced some counterintuitive results – thanks to slow average download speed in the UK in 2010, coupled with the power consumption of the console and energy intensity of the power system at the time, a store-bought disc was the lower emissions method of game distribution (again, this is in 2010). Very unexpected.
Updating this work almost a decade later was Joshua Aslan’s (2020) Engineering PhD project on ‘Climate Change Implications of Gaming Products and Services’. It remains an extraordinarily thorough piece of work, is extremely comprehensive, and still remarkably readable. Aslan worked on this research project at Sony, gathering data direct from Sony facilities similar to before, and has been a Senior Manager of Environment & Climate Strategy for them ever since. Aslan frames his inquiry through the same question as Mayers et al.’s earlier study, focussing on which method of distribution (as well as gameplay – he accounts as well for potential cloud streaming) has the lowest climate impact in the year of the study, which was 2019.
His conclusions were suitably complex for a PhD project, best summarised as it really depends. It depends on file size of the game, on how long players end up playing for, on the intensity of internet data transfer (i.e. on the efficiency of internet infrastructure and data centres), and of course, it depends on the intensity of various electricity grids supplying all these devices and locations. What we do get is a graph representing the combination of two important variables – hours played, and game file size. Plonk your assumptions about your own file size/player time expectations/etc and you can get a rough sense of which method is liable to have the lowest emissions (again, for the year 2019 and only in the UK).
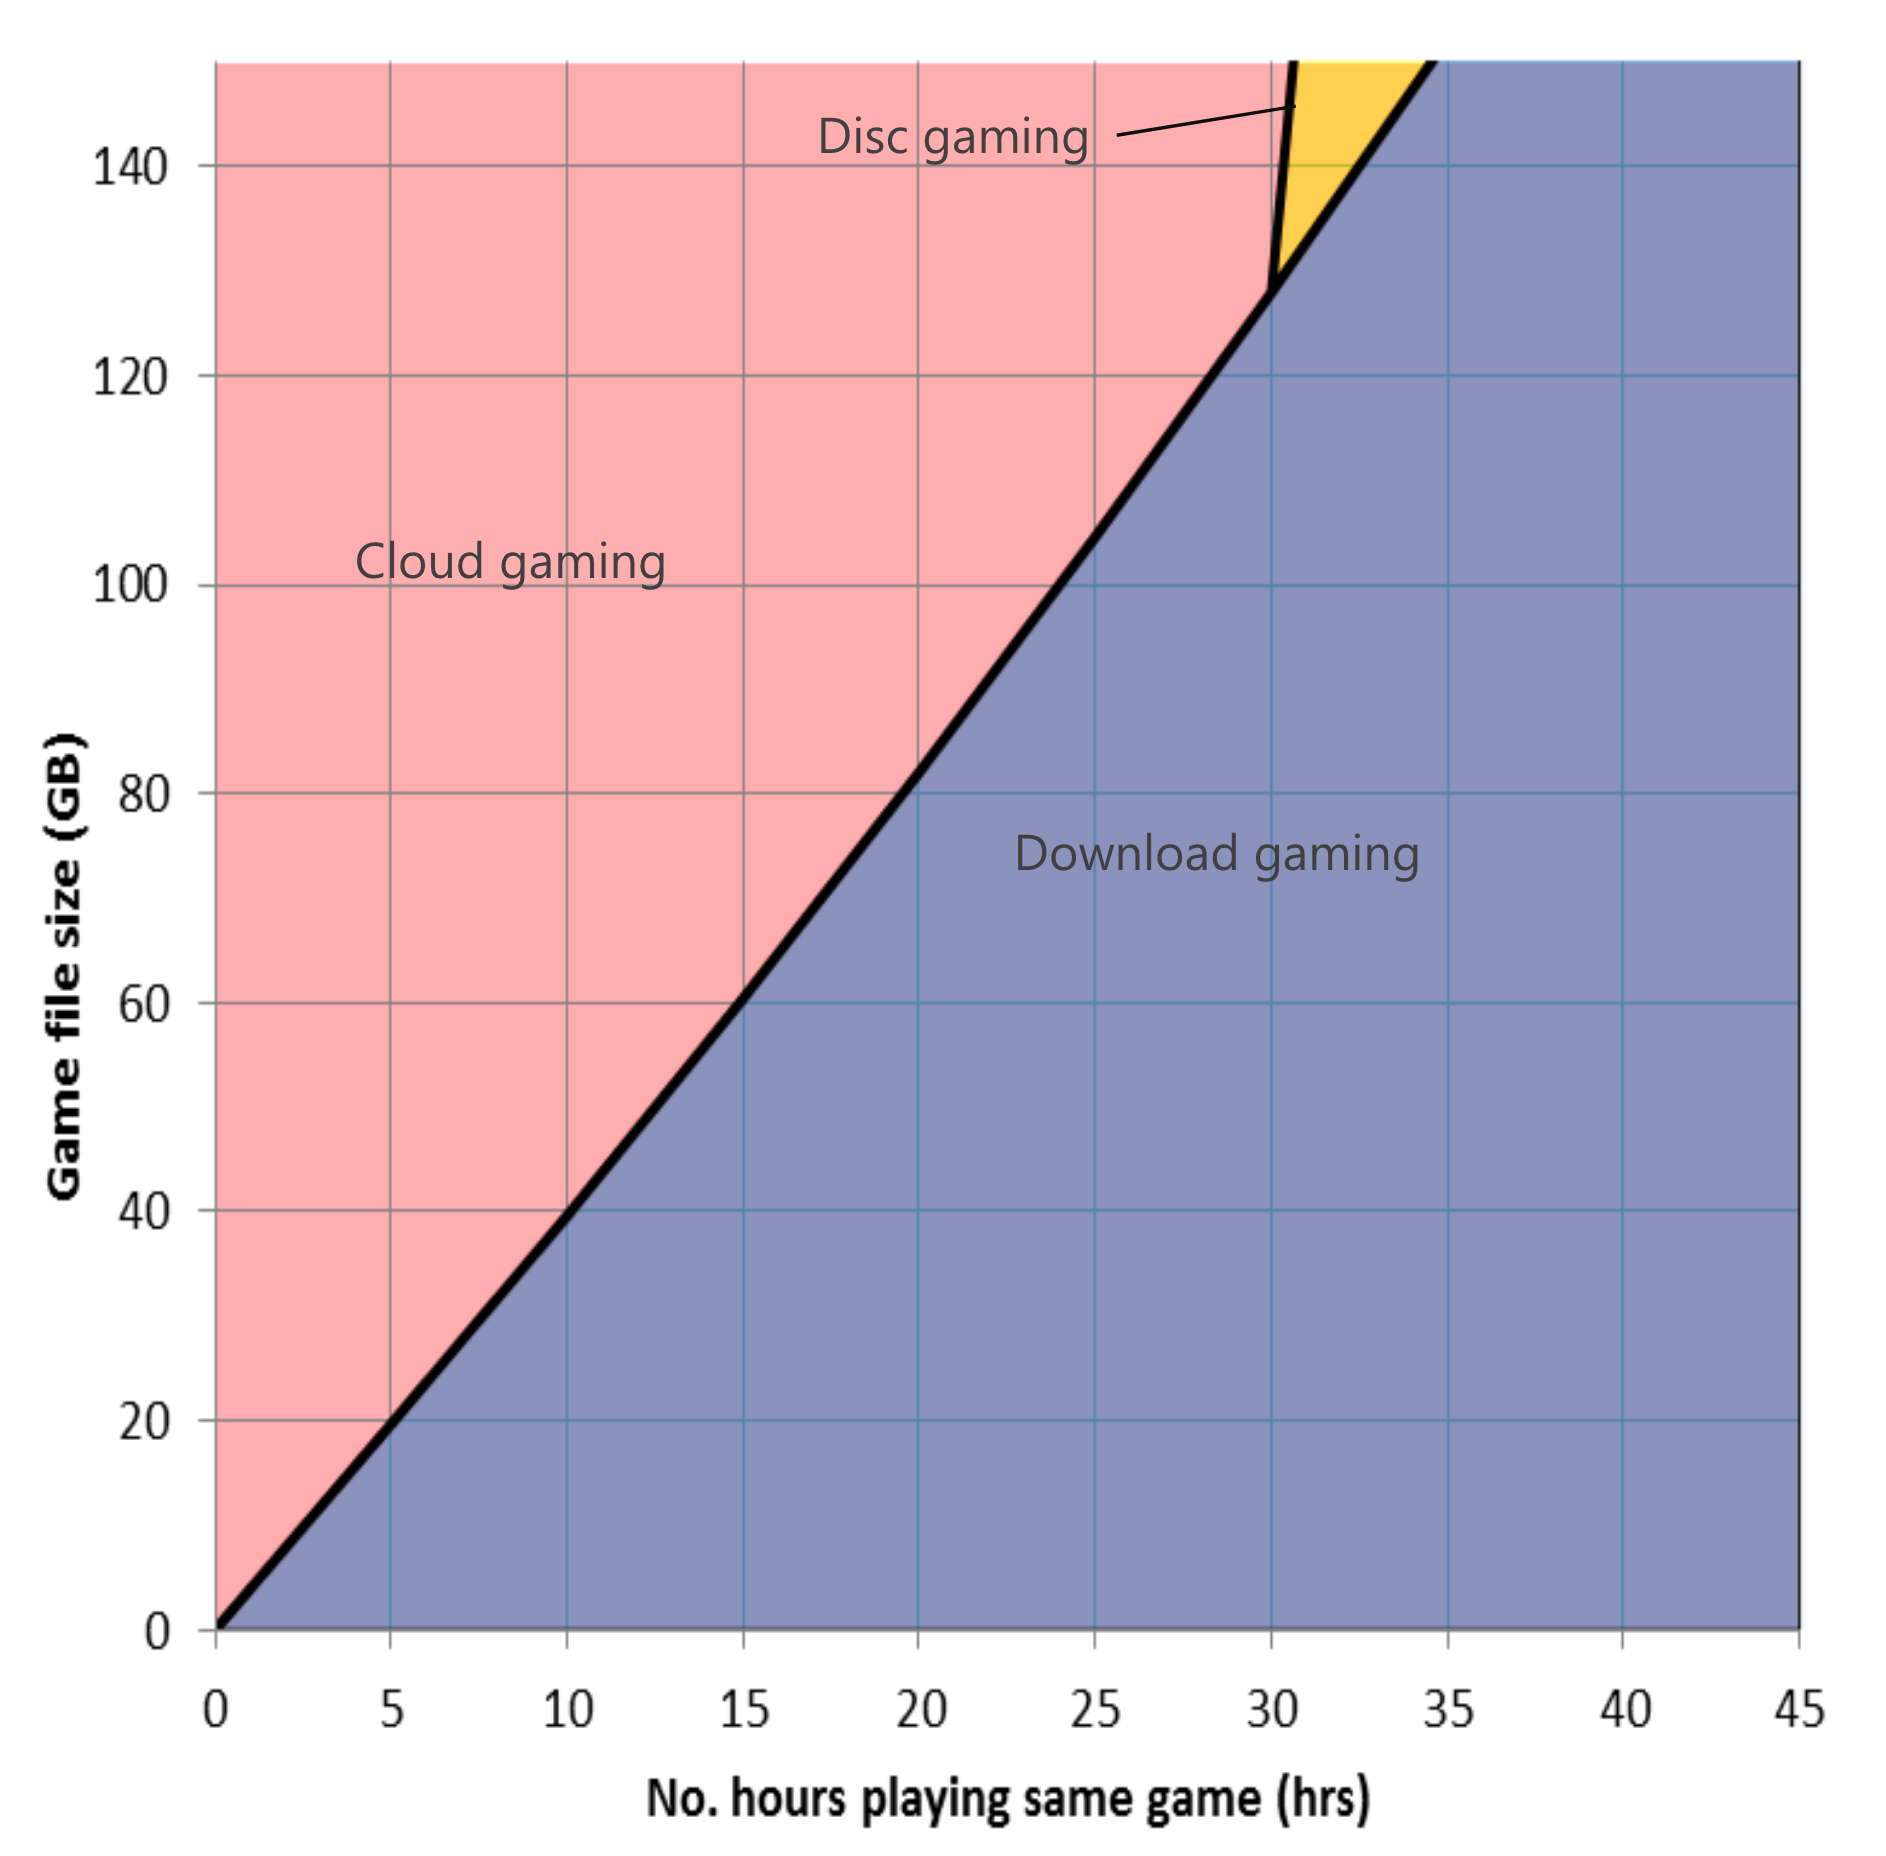
For long playtimes, and game files below a certain size, downloads come out ahead. For shorter total playtime, cloud gaming comes out ahead. And for really big downloads (140+ GB) which are only played for a specifically moderate length of time discs win out. It’s a weird series of results that again caution us against the simplistic answer “just do this!” Keep in mind however, that this is an analysis of the state of affairs at a specific time – 2019 – and it does not tell us what, exactly its going to be like in the future. I do think we can draw some conclusions and guides to action from it, but I’ll come back to this point at the end.
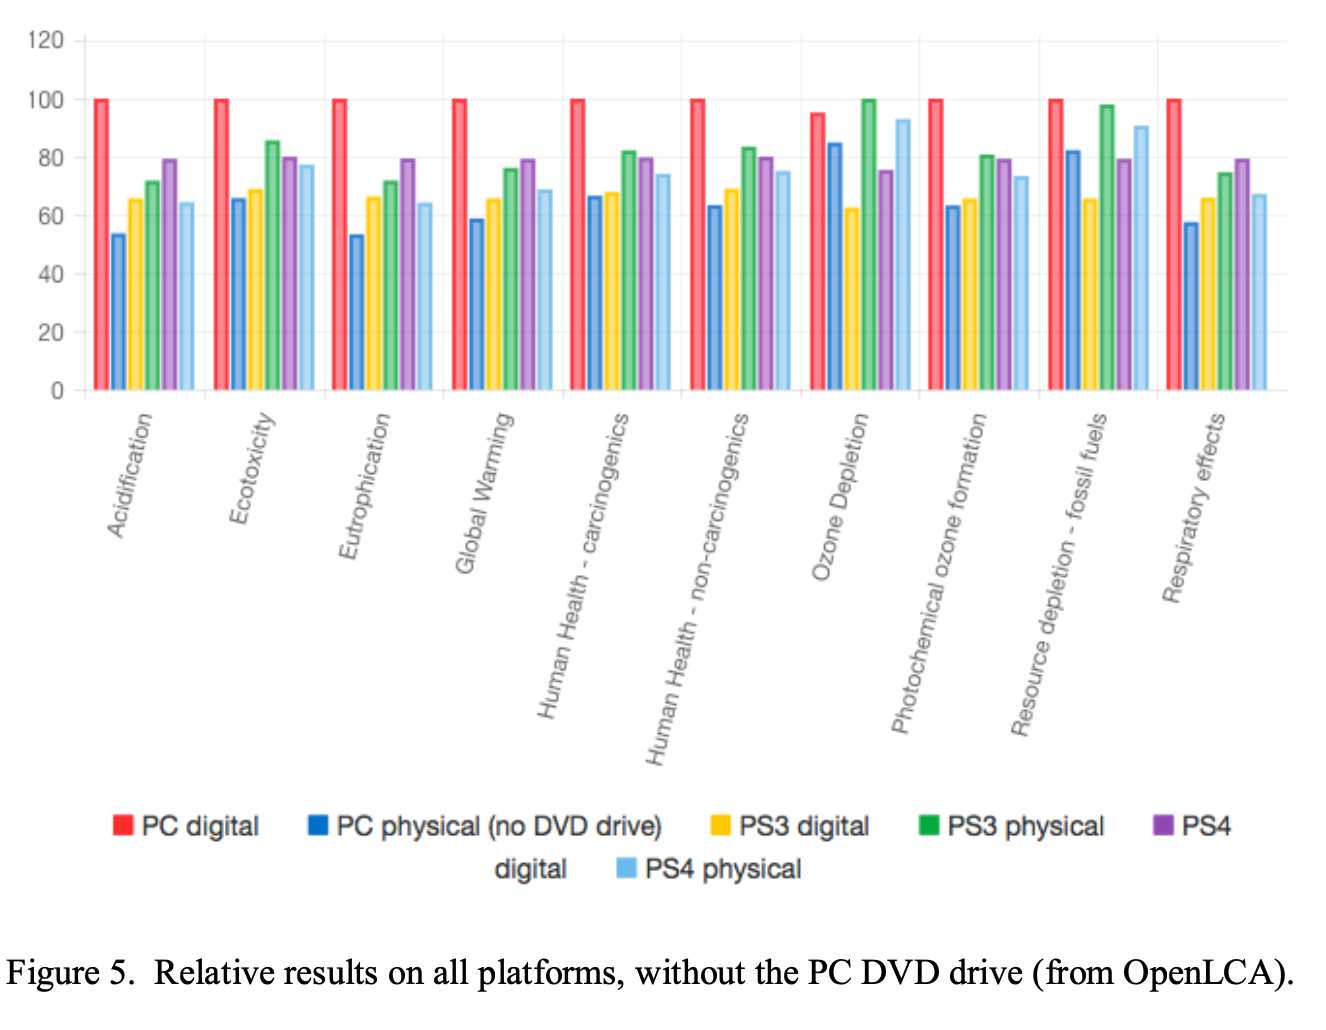
Lastly, the third study, which I have only recently come across, is a Masters thesis by a student at Harvard, Cathryn Buonocore who completed it in 2016. Buonocore’s work, which performs a similar lifecycle analysis of digital distribution side-by-side with physical distribution, includes some nice features beyond simply modelling CO2 and emissions as it identifies other ecological impacts associated with different platforms and methods of game distribution. It does however suffer a bit from methodological complexity, and uses a US EPA eco inventory that dates back to 2008. This plus a few other factors, make it a bit less useful for our purposes, so I mostly bring it up here as a point of comparison, and conformation alongside the others.
Buonocore compared digital and physical sales for PS3, PS4 and PC games (the last time I bought a boxed PC game was probably 2008?) and there are some… quirks to the analysis. Nevertheless, we get this nice comparative chart of the relative eco-impacts of the different platforms, including impacts beyond CO2e emissions. Leaving out an optical DVD drive from your PC build apparently has a pretty big impact.
One thing we don’t get, however, in Buonocore’s study is a breakdown of the components that go into the CO2e emissions – so it’s not as easily applicable to our distribution calculations. All three studies studies are lifecycle analyses (or LCA), so they all include emissions from playing the game, which I want to examine separately. Both Mayers et al. and Aslan’s papers include enough detail that it allows us to “remove” the play emissions component from their LCA. That's outside the part we’re interested in, and is up next in the series. Instead I'm sticking to only the manufacturing and transport of discs (for physical distro) and the electricity used by all the devices involved in the download (for digital) plus the emissions of disposal at end of life. So in all the figures that follow, just know that I’ve subtracted the play duration emissions to arrive at these.
Disc Distribution
Alright time for some numbers.
Mayers et al. in their study reached a figure of 1.2 kg of CO2 equivalent emissions for the production and distribution of each PS3 disc around 2010.
Aslan’s updated study includes the following breakdown of the relevant LCA components that I’m attributing to the disc distribution process:
0.27 kg CO2e for Disc Production
0.00 kg CO2e for Disc Distribution
2.04 kg CO2e for Disc Retail
0.18 kg CO2e for Disc Disposal
For a total of 2.49 kg of CO2 equivalent emissions per PS4 disc — a doubling of Mayers et al.’s estimate from a decade earlier. You’ll notice that the “distribution” component of Aslan’s study is so small as to be nothing. This is because on a per-disc basis, the weight of a single disc is tiny (about 15grams), and so many of them fit on a truck that the transport emissions are basically spread across so many they don’t register. However, this only really holds for the specific case that Mayers et al. and Aslan are looking at, disc distribution to the UK.
There are two factories in the world that manufacture PlayStation discs – one in Thalgau, Austria for the European market (and, perhaps, the rest of the world – certainly Australia's discs) and one in Terre Haute, Indiana for North America. There used to be one right here in Australia actually, but it closed. In Digital Games After Climate Change I did some (entirely hypothetical) calculations of the per-disc emissions cost of sending discs from Austria to Australia: somewhere around 0.179 kg of CO2 per disc if they went by air (and there is good reasons to believe that at least some discs are shipped this way to meet release deadlines, even if not all are).
So that’s what we know about the emissions costs of individual PlayStation discs. There’s a (relatively) fixed emissions component from manufacturing and retail, and one (extremely) variable one that is the transport emissions themselves, based on the distance and mode of transport. That variable transport component can be almost nothing, if its within the deeply interconnected European region, or it could be as high as 7% of the total emissions (if flown to Australia). Just a little bit of variability there – but the majority of it is still in that production/retail/disposal bit.
Also, what about Xbox discs, and Nintendo cartridges? I have no idea! If it seems like I’m picking on Sony it’s only because we actually have this data because they went to the trouble of collecting and publishing it. So kudos to them for having the guts to look at the sometimes ugly truth of these emissions. We remain in their debt.
Digital Distribution
Digital distribution ditches the fixed costs of making discs, does away with all that plastic (in a previous post I estimated that 97,301 tons of plastic discs were made between 2000 and 2018 or the same weight as 236 fully loaded 747s). Digital distro also does away with the substantial emissions from bricks-and-mortar retail, and the pesky variability of transport distances and modes. Instead, it swaps in a variable degree of emissions based on the following factors: the size of a game download, the download speed, internet infrastructure and data centre energy efficiency, and the energy use of (relatively fixed) customer premise equipment (CPE) like routers and wifi.
Mayers et al. (2015: 7) concluded that for 2010, downloading an 8GB PS3 game resulted in emissions of 2.4 kg–8 kg of CO2e.
A lot of things changed between 2010 and 2019, and so Aslan’s study has changed a few variables a bit. The average file size of a game increased a lot, but not by as much as internet speeds. For a PS4 game of average size (now 39.3 GB in 2019) here’s Aslan’s (2020: 196) list of the itemised components of the digital distribution footprint:
- PSN store game retail 0.003 kg CO2e/download
- CDN 0.051 kg CO2e/download
- Access network 0.336 kg CO2e/download
- CPE 0.400 kg CO2e/download (Customer premise equipment— router, modem, etc.)
- Console download energy 0.034 kg CO2e/download
- Console energy game file deletion 0.001 kg CO2e/download
I love that last item – energy for deleting the game file itself. It’s such a nice touch. Like I said, it’s so thorough it’s almost ridiculous.
When we add up all those numbers, we get 0.825 kg CO2e for a digital download of a PS4 game in 2019. In Digital Games After Climate Change I wrote this paragraph about what it tells us:
Even though game file sizes have more than tripled in the ten years since the earlier study, digital distribution emissions have reduced to at least one third, and potentially as much as a tenth of previous emissions. This can be explained as a product of increases in energy efficient internet infrastructure, greatly increased average download speeds which sees consoles spend less time ‘on’ while waiting for files to download, and lower overall emissions factors for power consumed.
And to underscore that point I found this really neat piece by Kyle Orland in Ars Technica with some great data on game file sizes and average download speeds in the US up to and including 2020.
How many games are sold in a year?
The last thing we need to be able to figure out this part of the game industry’s annual emissions footprint are some figures for annual sales of both digital and physical games. That’s tricky because we mostly have dollar values rather than unit sales numbers. What’s the average price of a PS4 or PS5 game sold? Your guess is as good as mine, in fact maybe better – if you have any data or ideas, let me know.
According to Statista, in 2020 Sony had “Full game and first party gaming software unit sales” worth $338.9 million USD, also noting that, “about 67 percent of PlayStation game unit sales were via digital channels” – a huge but unsurprising shift from the 95% physical split in Mayers et al’s study 10 years earlier.
What’s the average cost of a Sony game these days? Again, help me out here if you know more, but as a stab in the dark let's say $40 USD just because that’s far enough below the $60 price point to account for the many games that will be bought on sale and at lower prices. Divide the $338.9m by a $40 average priced game and we get 8.47m PS game sales in 2020. That seems a bit low, but let's stick with it.
If 67% is digital, that’s 5.68m digital sales x 0.825 kg CO2e per digital download which equals 4,686 tCO2e emissions.
The remaining 2.8m physical disc sales x 2.49 kg CO2e per disc sale equals 6,972 tCO2e emissions.
Add those up and 2020 PlayStation distribution emissions for 2020 were probably somewhere around 11,658 tCO2e. Plausible, but could be an underestimate if the average price of a PS game is lower than the one I picked.
There’s a ton of extra detail we could go into here if we had time – other differences between physical and retail sales (bricks and mortar take a cut that doesn’t occur for digital), different regional pricing arrangements, different disc based distribution costs for countries, none of which I accounted for here.
What I do want to do before I finish up this already long post is look at how much of the rest of the games market is left out of this figure. There’s all of Nintendo’s sales, all of Microsoft Xbox sales, all of Steam’s PC game sales and the 1000 pound gorilla of mobile game downloads (though they’re at least these last two are 100% digital). There’s also other PC retailers as well, like GOG.com, which shows up in a big part of CDPR’s Scope 3 footprint. Maybe I’ll come back to that in the future.
In researching this piece, I was able to find some Nintendo switch software sales numbers for 2019 onward (“Software sales units include both packaged and downloadable versions of software” – no details on the proportion of physical vs digital sales though). Here’s the chart:
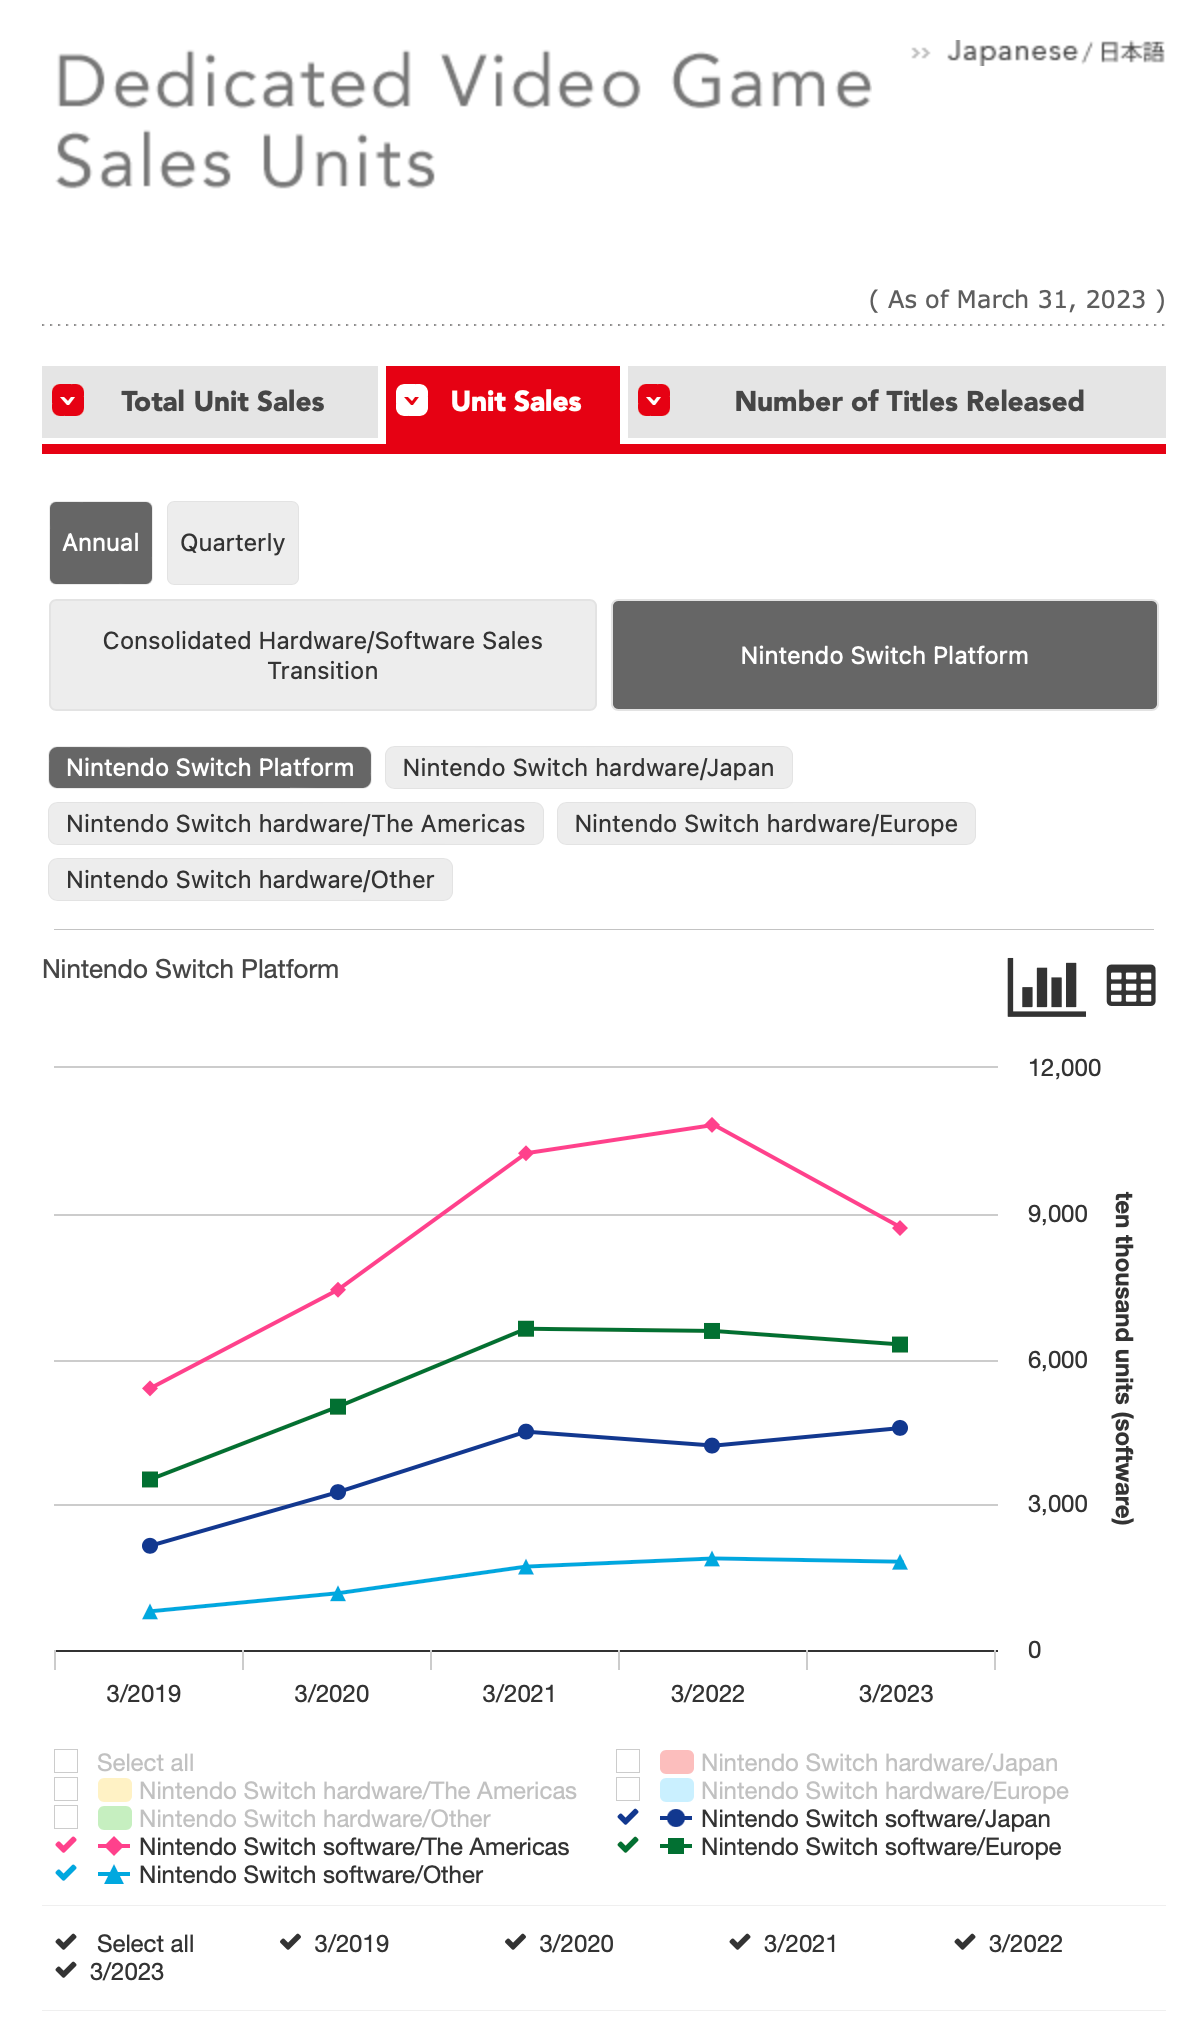
Because that chart is not easy to read, here's the actual numbers:
Americas: 74,280,000
Europe: 50,170,000
Japan: 32,560,000
Rest: 11,710,000
TOTAL: 168,722,020
That’s a humungous amount of software unit sales, and makes me think that I’ve almost certainly undercounted the PS sales numbers by picking such a high average PS game price. But there really are so many Nintendo Switches out there now. Please tell me if you have better data sources for anything I’ve discussed and I’ll post updates. Maybe the Switch money machine really does goes brrrr?
The real question though is what are the emissions of making a Switch cartridge? Is it more than a PS disc? Less? I doubt it’s less, but I could be wrong! My BotW cartridge is 1.7g vs 15g for the average PS disc, but it seems more complex than just wedging some foil between two sheets of plastic and zapping it with a laser. Is it just a fancy flash card? If anyone has any ideas about the embedded emissions or any relevant data sources for cartridges please send it my way. Nintendo! Do an LCA of your games please! Microsoft too, for that matter.
Because there’s just too many differences between these two platforms, I’m just not willing to do any estimates for the Switch – even with actual sales numbers. Switch games are almost certainly on average smaller downloads, and the Switch itself uses only a fraction of the same amount of power while downloading – I think around 80 times less than a PS5. But it’s also sold so many copies and there are so many Switches out there now. I really wish we had more data.
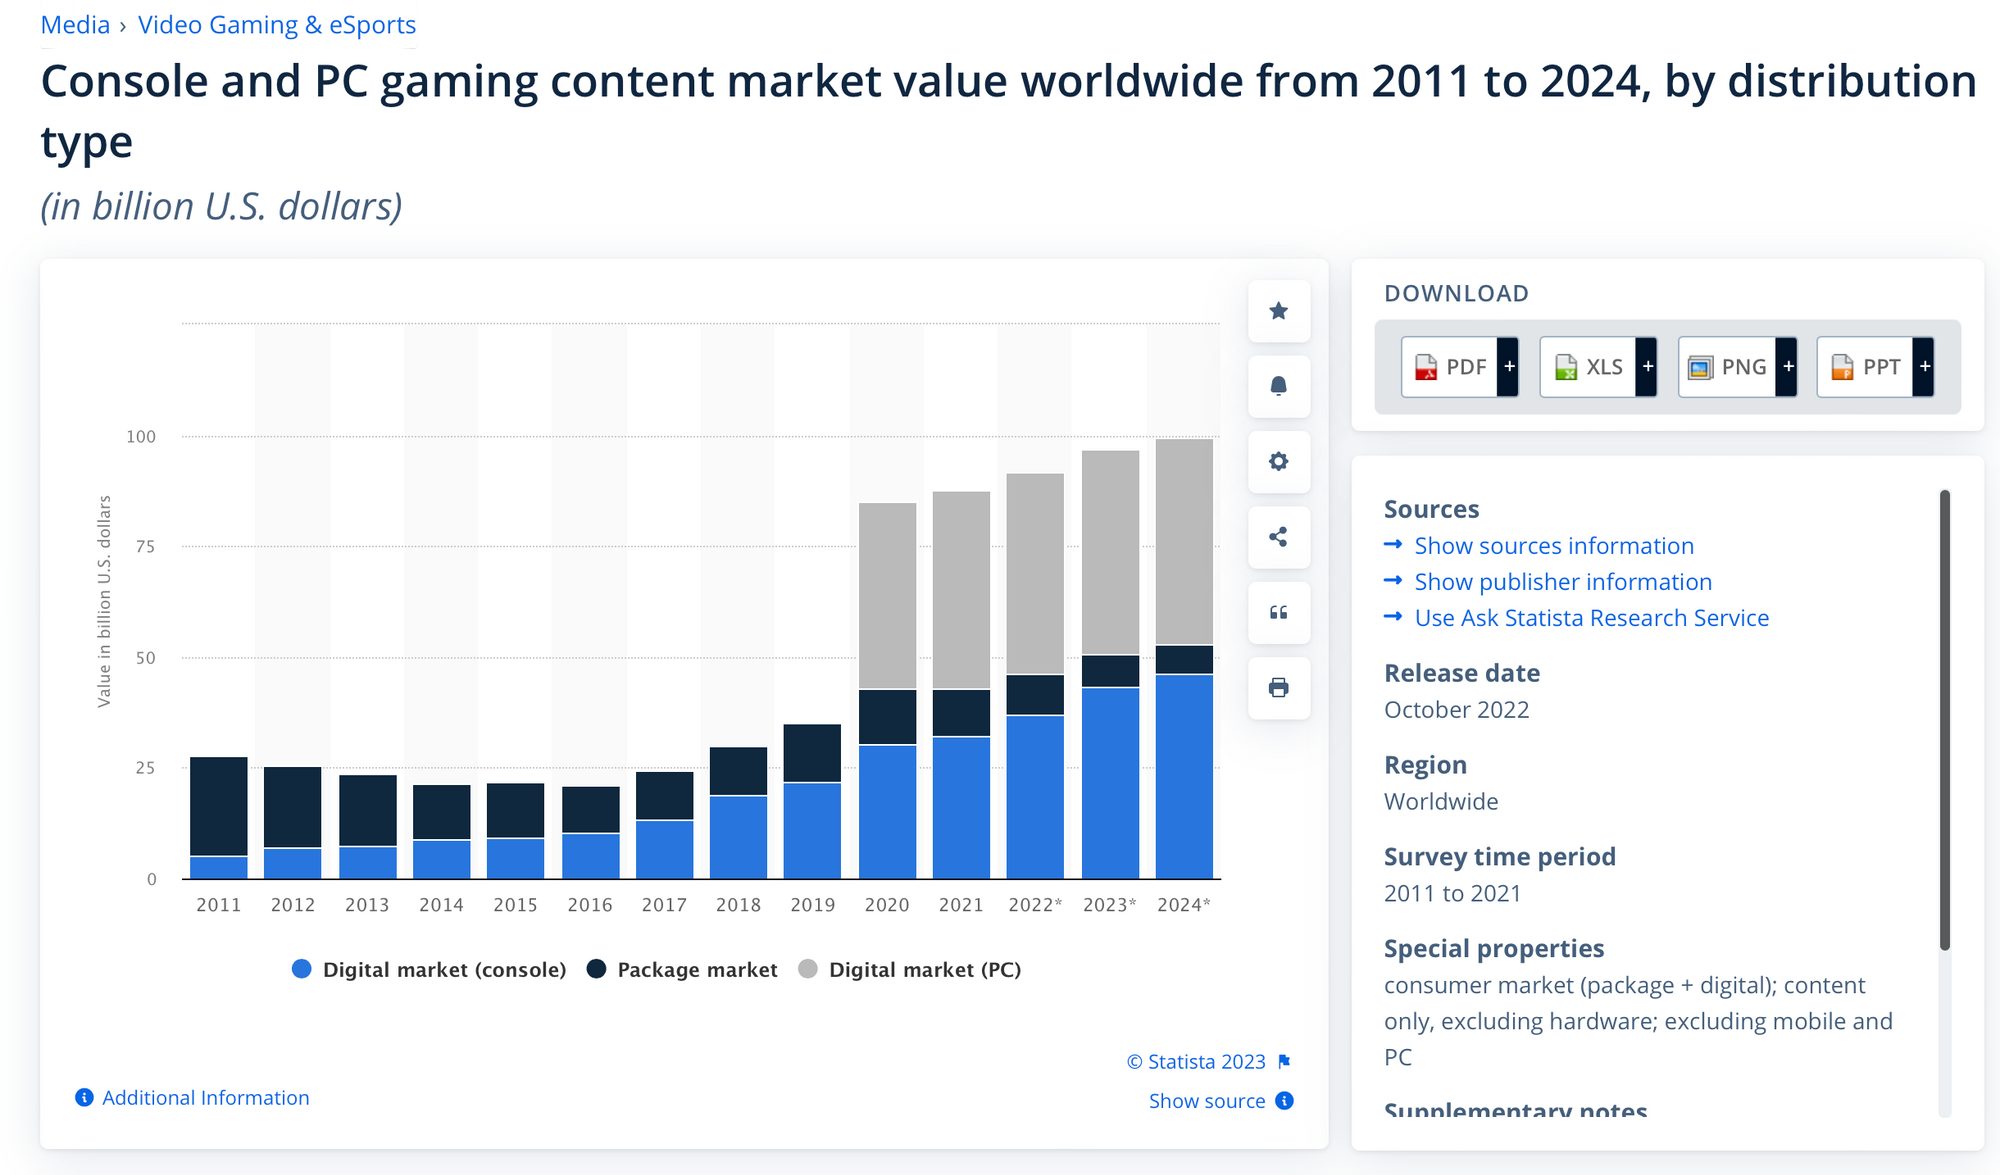
What about PC? Well, according to this Statista chart, the digital PC games market is as much as 50% of the total games market, at least by dollar value. Now that’s complicated by DLC, in-game currencies, Battlepasses, etc. but it’s… big.
Lastly, mobile gaming – it’s huge, and it’s all downloads. I don’t think I even have a rubric in mind (yet) for how to approach calculating these, given the sheer scale of that market. It’s a big gap in my own awareness as it’s not a huge part of my gaming habits even though it’s (apparently) the majority of gaming revenue these days. This (paywalled) Statista page suggests that mobile game download figures are in the billions which is wild. But again, lower power consumption per device than the Switch, and probably smaller average downloads, I would figure. Reach out if you have numbers!
Final thoughts
So I didn’t manage to reach a single overall number for games industry distribution, but we did learn some key things along the way. Here’s my 3 main takeaways:
- Even though all of the LCA studies so far found times and places where disc distribution was marginally the better climate option, the trend is only bending towards digital distribution dominating and reducing emissions. Which is good news! It’s basically happening automatically, though it could be accelerated with the right industry support. When you add to that picture the other burdens that disc distribution places on the planet like plastic waste, its unequivocal. The only sustainable future model of distribution in the games industry is 100% digital.
- Even just by looking at Sony’s distribution emissions, we found that game distribution (by disc and by digital) is at least in the tens of thousands of tonnes per annum. Once we add in all of PC, Xbox, Switch, and mobile, that could go to, at a hunch, maybe 100,000 tCO2e per annum? Maybe a bit less? It really depends – more research required!
- There are some huge remaining data gaps. We need LCAs for Switch cartridges and downloads, for Steam downloads, for Xbox. Mobile gaming is perhaps an even more so, and it’s something that I’m going to have to rectify in some future writing.
Okay that’s long enough. Hope it’s food for thought and a guide for action.
If you liked this piece, don't forget that AfterClimate is available to perform research just like this for you, your studio, etc. We're always happy to talk about what we can do to help you get clarity on your emissions footprint and where to prioritise. 2030 net zero targets are approaching fast!