How do we measure the carbon footprint of installing & updating games?


This week, we’ve released a new component of the SGA Standard – covering what the Greenhouse Gas Protocol calls Scope 3.9: Downstream transport and distribution. There are two key features to activities that fall into this category: 1) it has to be an activity that is involved in getting products and services into the hands of customers (i.e. gamers), and 2) it also has to be an activity that isn’t paid for by the company itself.
For games, there are two main ways they get to players – the old way was via manufacturing and sending plastic discs and cartridges around the world (which I’ve written about previously here and here), but increasingly it's done as digital downloads. For the SGA Standard, we decided (at least for now) that it’s better to direct companies to their distribution partners for data on physical disc distribution, since it's very hard to estimate from the outside (though we can help you to ask for the data), and instead focus on the second part – the downloading of game files across the internet.
Downloading games is rarely a one-and-done thing. Game updates are expected for most games, whether for live service content updates or just fixing bugs after release, but both installs and updates activate the same physical systems – a data centre or edge network processes a request for a game file (for the install or update) that serves up the data to the user by transmitting it across physical internet infrastructure to the end user's device. A lot of these servers are pushed as close to players as they can be. Steam, for instance, locates its servers alongside the switching hardware of individual ISPs, enabling super-fast downloads with as few hops between them as possible. I’ve read that Netflix does this, too, as it’s an effective approach to reduce latency and increase speeds. In between those servers, there are fibre optic cables and routers. Then, at the very end of the process, there is a device that is downloading the files – a PS5, a mobile phone, a gaming PC – which has to be on and running (possibly in some ‘efficient’ state like standby, or just idle) to accept and store the incoming files.
So that is the physical system that defines the elements to measure in the S3.9 Standard, and it points to needing to know information about three main things: the server, the internet backbone network, and the device. But the use cases that activate those three elements are just two events: initial game installs, and game updates. The S3.9 data input sheet automates the calculations for each of these use cases and system elements.
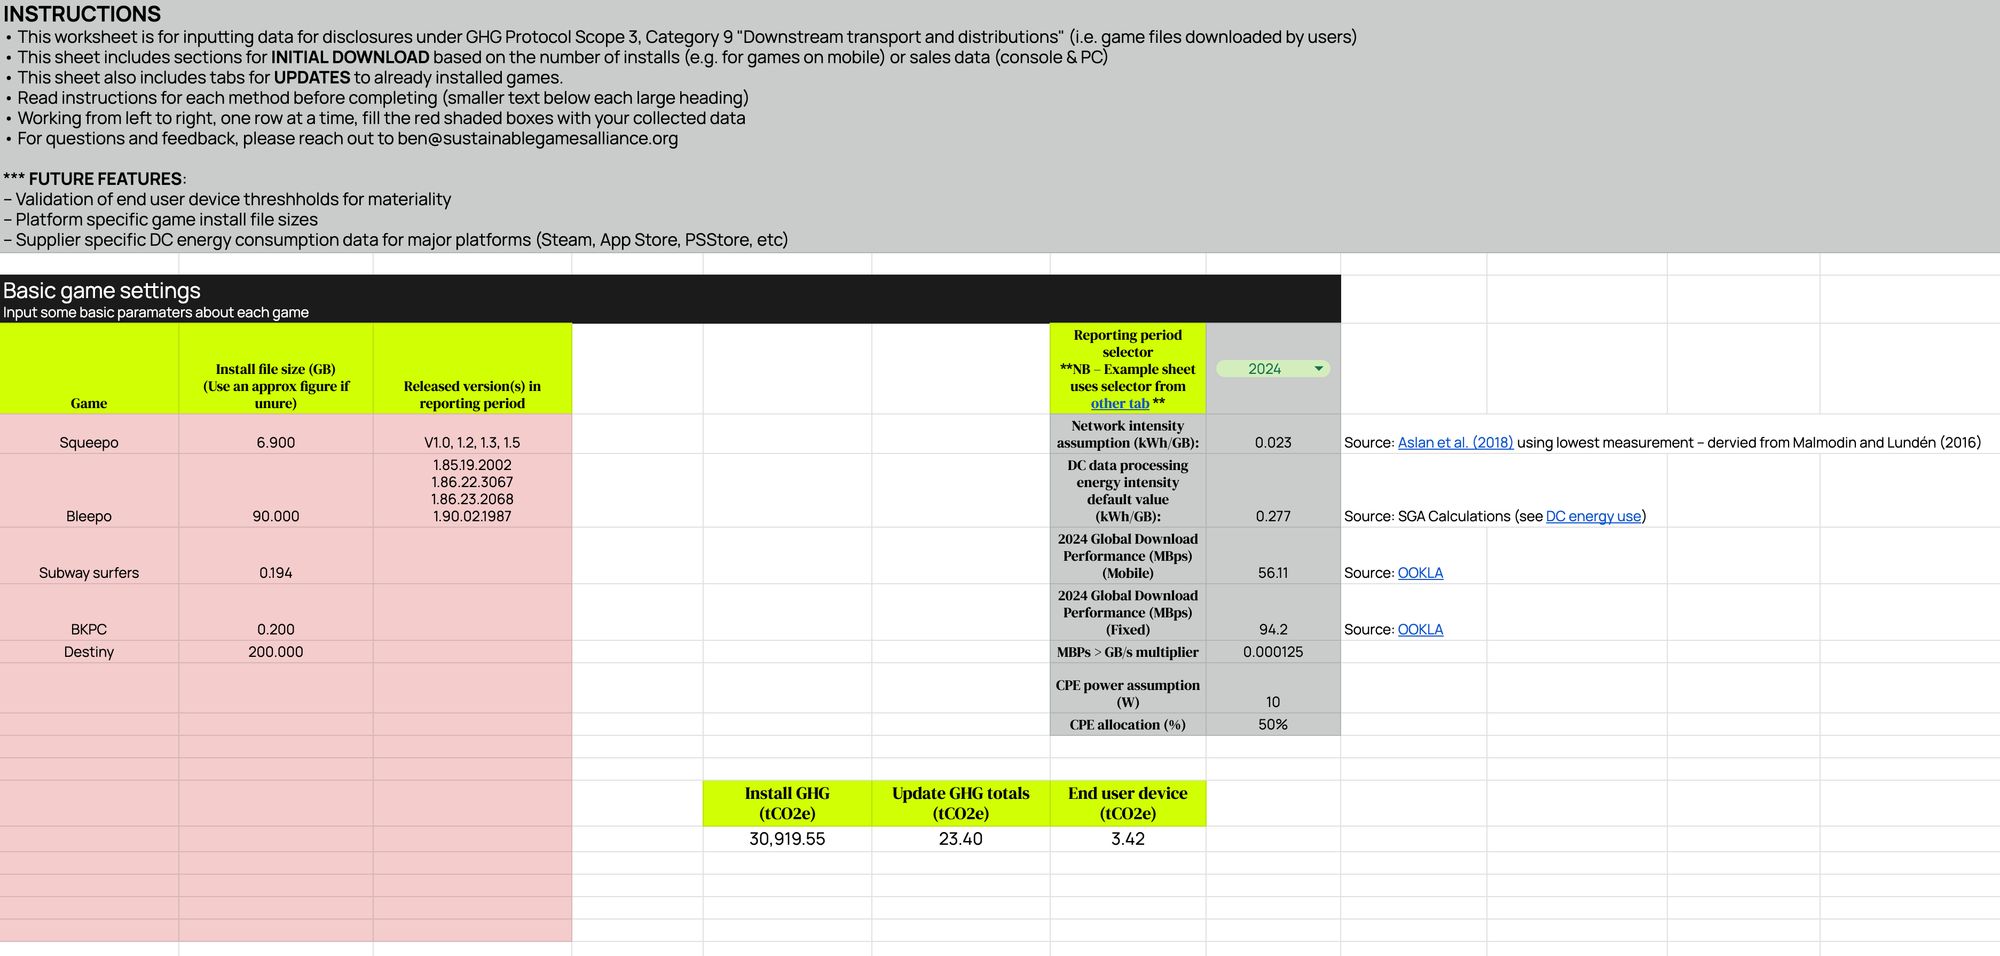
There are some basic settings you need to enter at the top of the data input sheet that include the file size of the game, and the game name, and then you're good to go.
Here’s a screenshot of the section we have pre-formatted to work with Steam export data. (Shout out to friend-of-GTG Brendon Keugh for sharing the real download data from Brandon Keuogh’s Putting Challenge on Steam) The Steam backend outputs data in two columns: one for the Region the download happened in, and one for the total number of downloads. Copy and paste that into this section of the sheet and voilla! You will get automatic estimates of the GHG emissions we think are associated with those downloads. There's a column to override the file size you enter at the topic in the basic settings – for cases where specific regions have a different file size (thanks to localization files for instance), and there's also a column you can use if you know from your DC supplier what the energy intensity is of service up the data for downloads. More on that in a second.
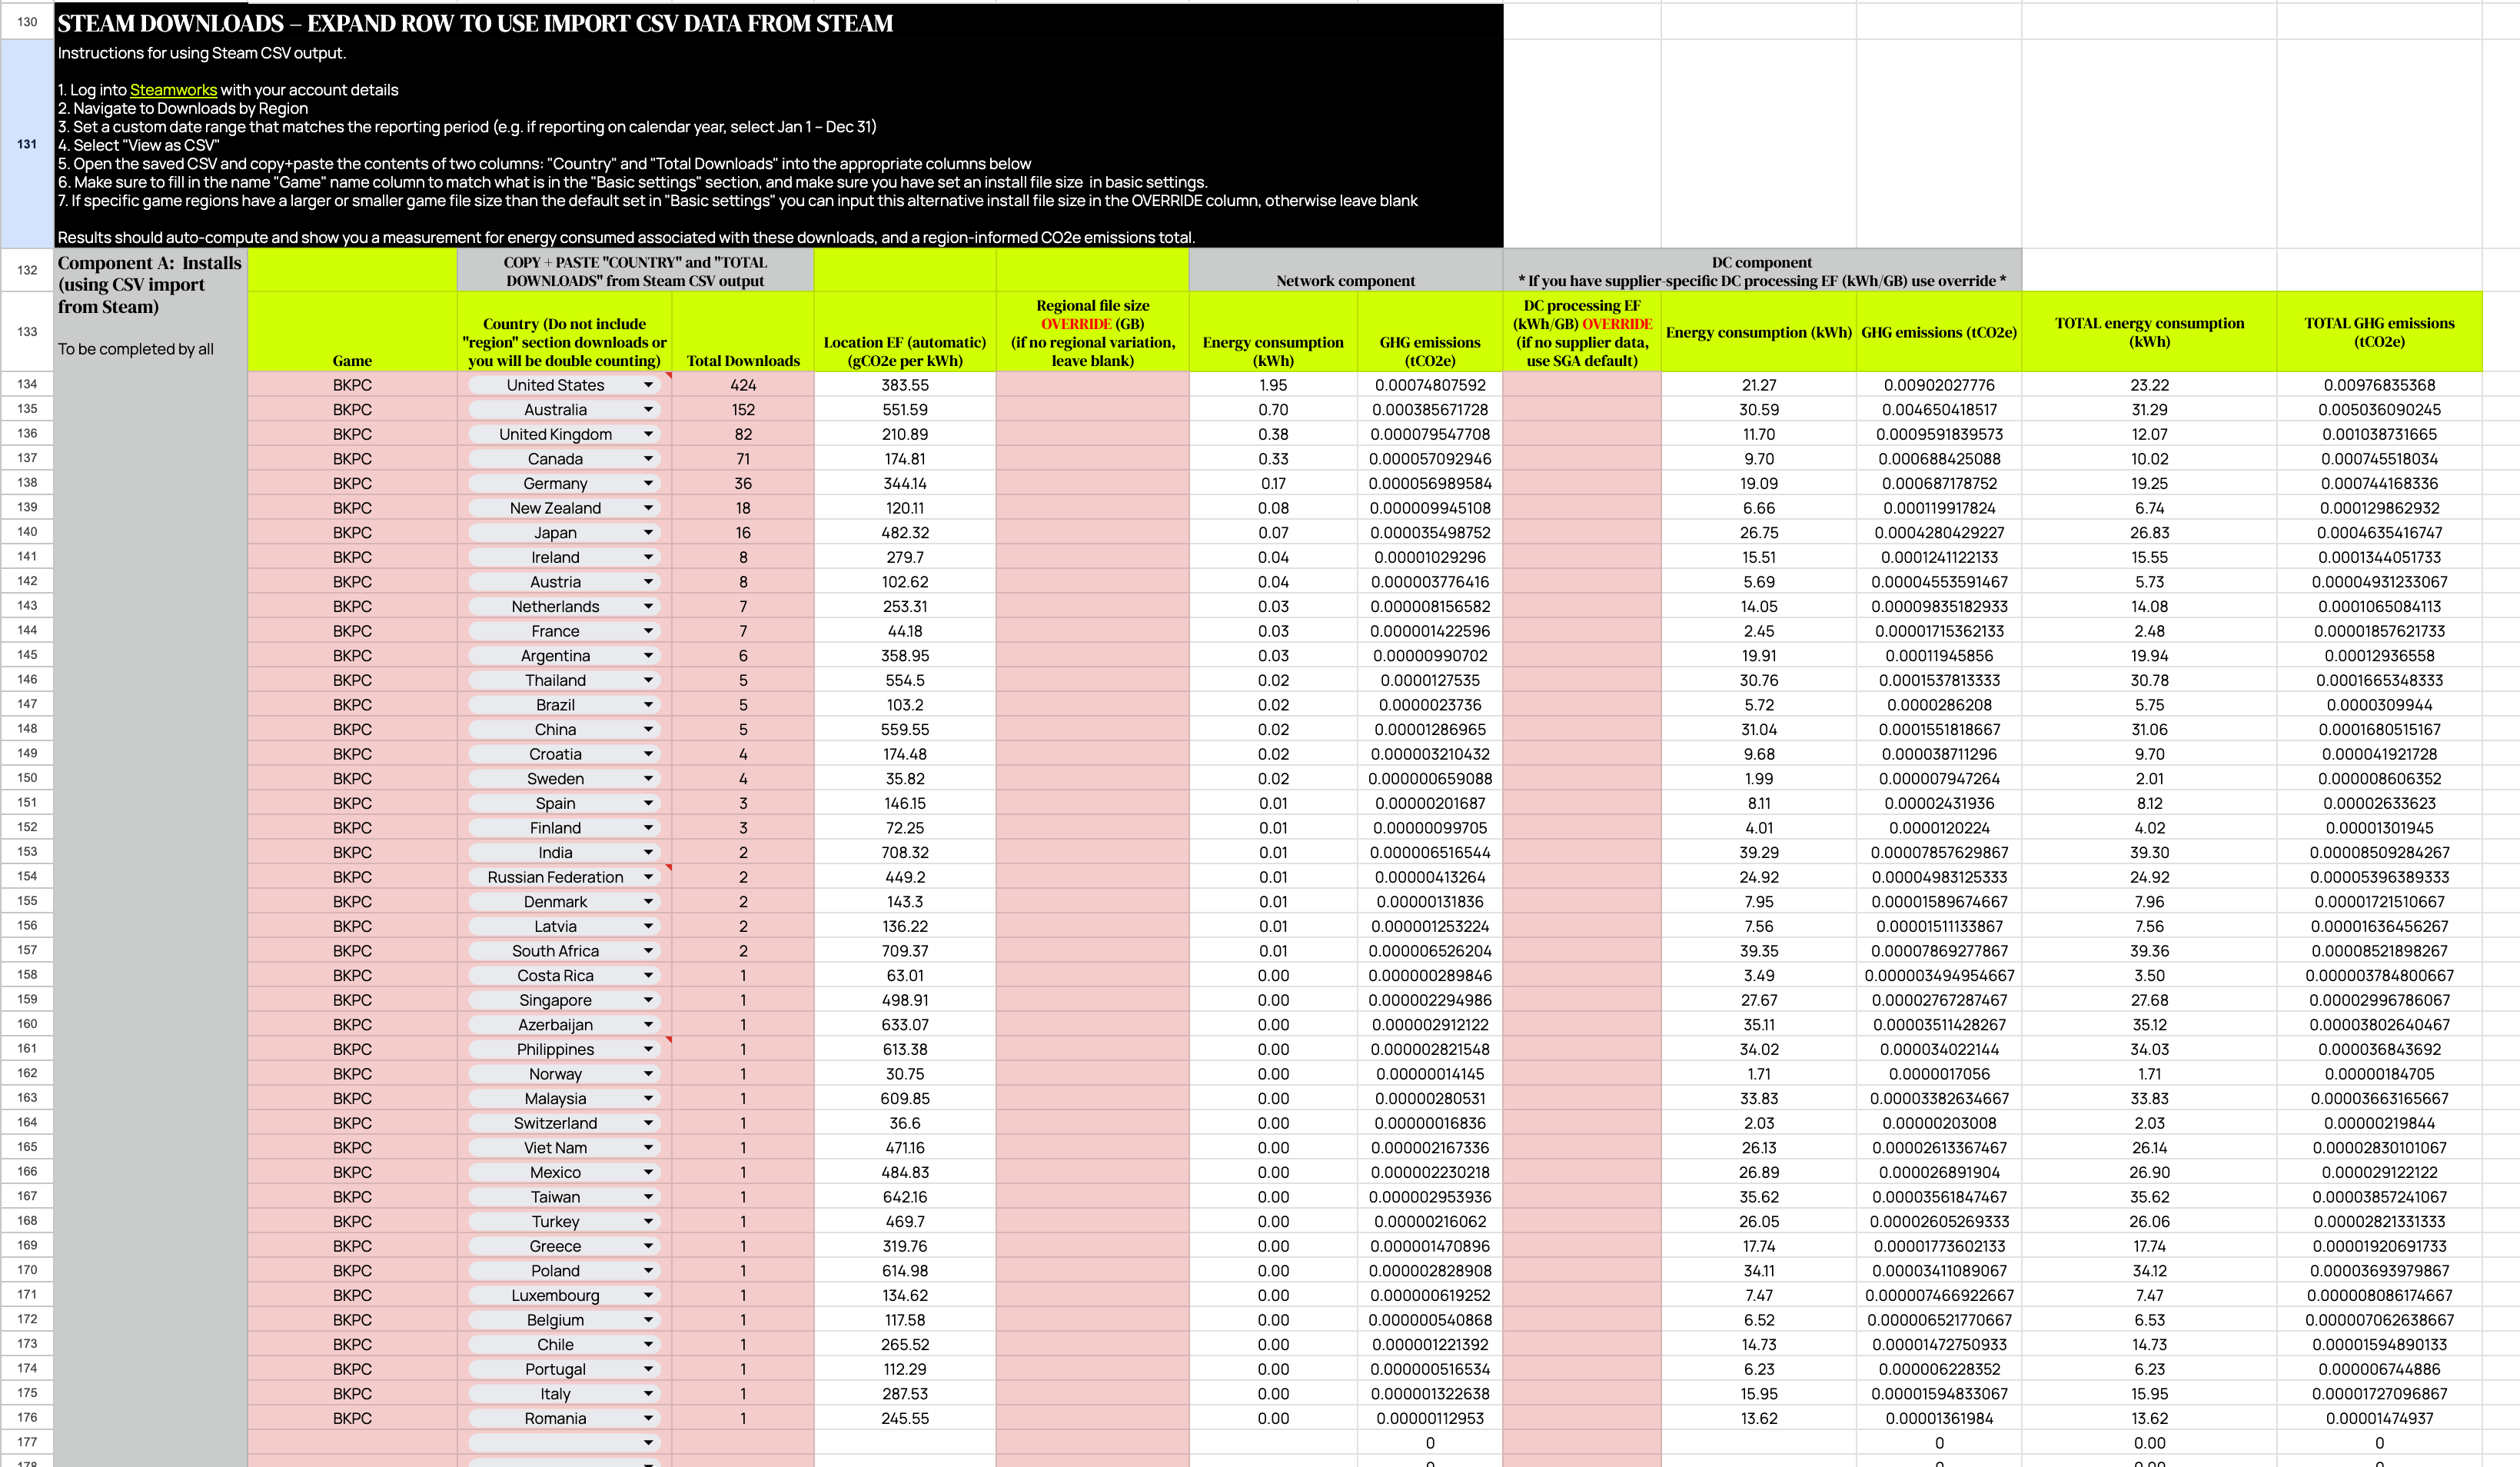
If you have a game hosted on Steam, you can go to the data input sheet right now, make a copy of it, and copy and paste the export from your Steamworks data. Give it a try and tell me how it goes!
But let’s talk about how we get to these numbers. Remember that we’ve identified the components of the system – the server, the internet, and the receiving device. We’ll put the receiving device to one side and come back to it – let’s focus instead on the internet and the server for now.
Research on the energy intensity of internet transmission networks has pointed to the following trajectory, which sees the amount of electricity used to send a GB of data across the internet halving every year. Here’s the chart showing this, from the most recent paper on the topic, by Aslan, et al. (2017).
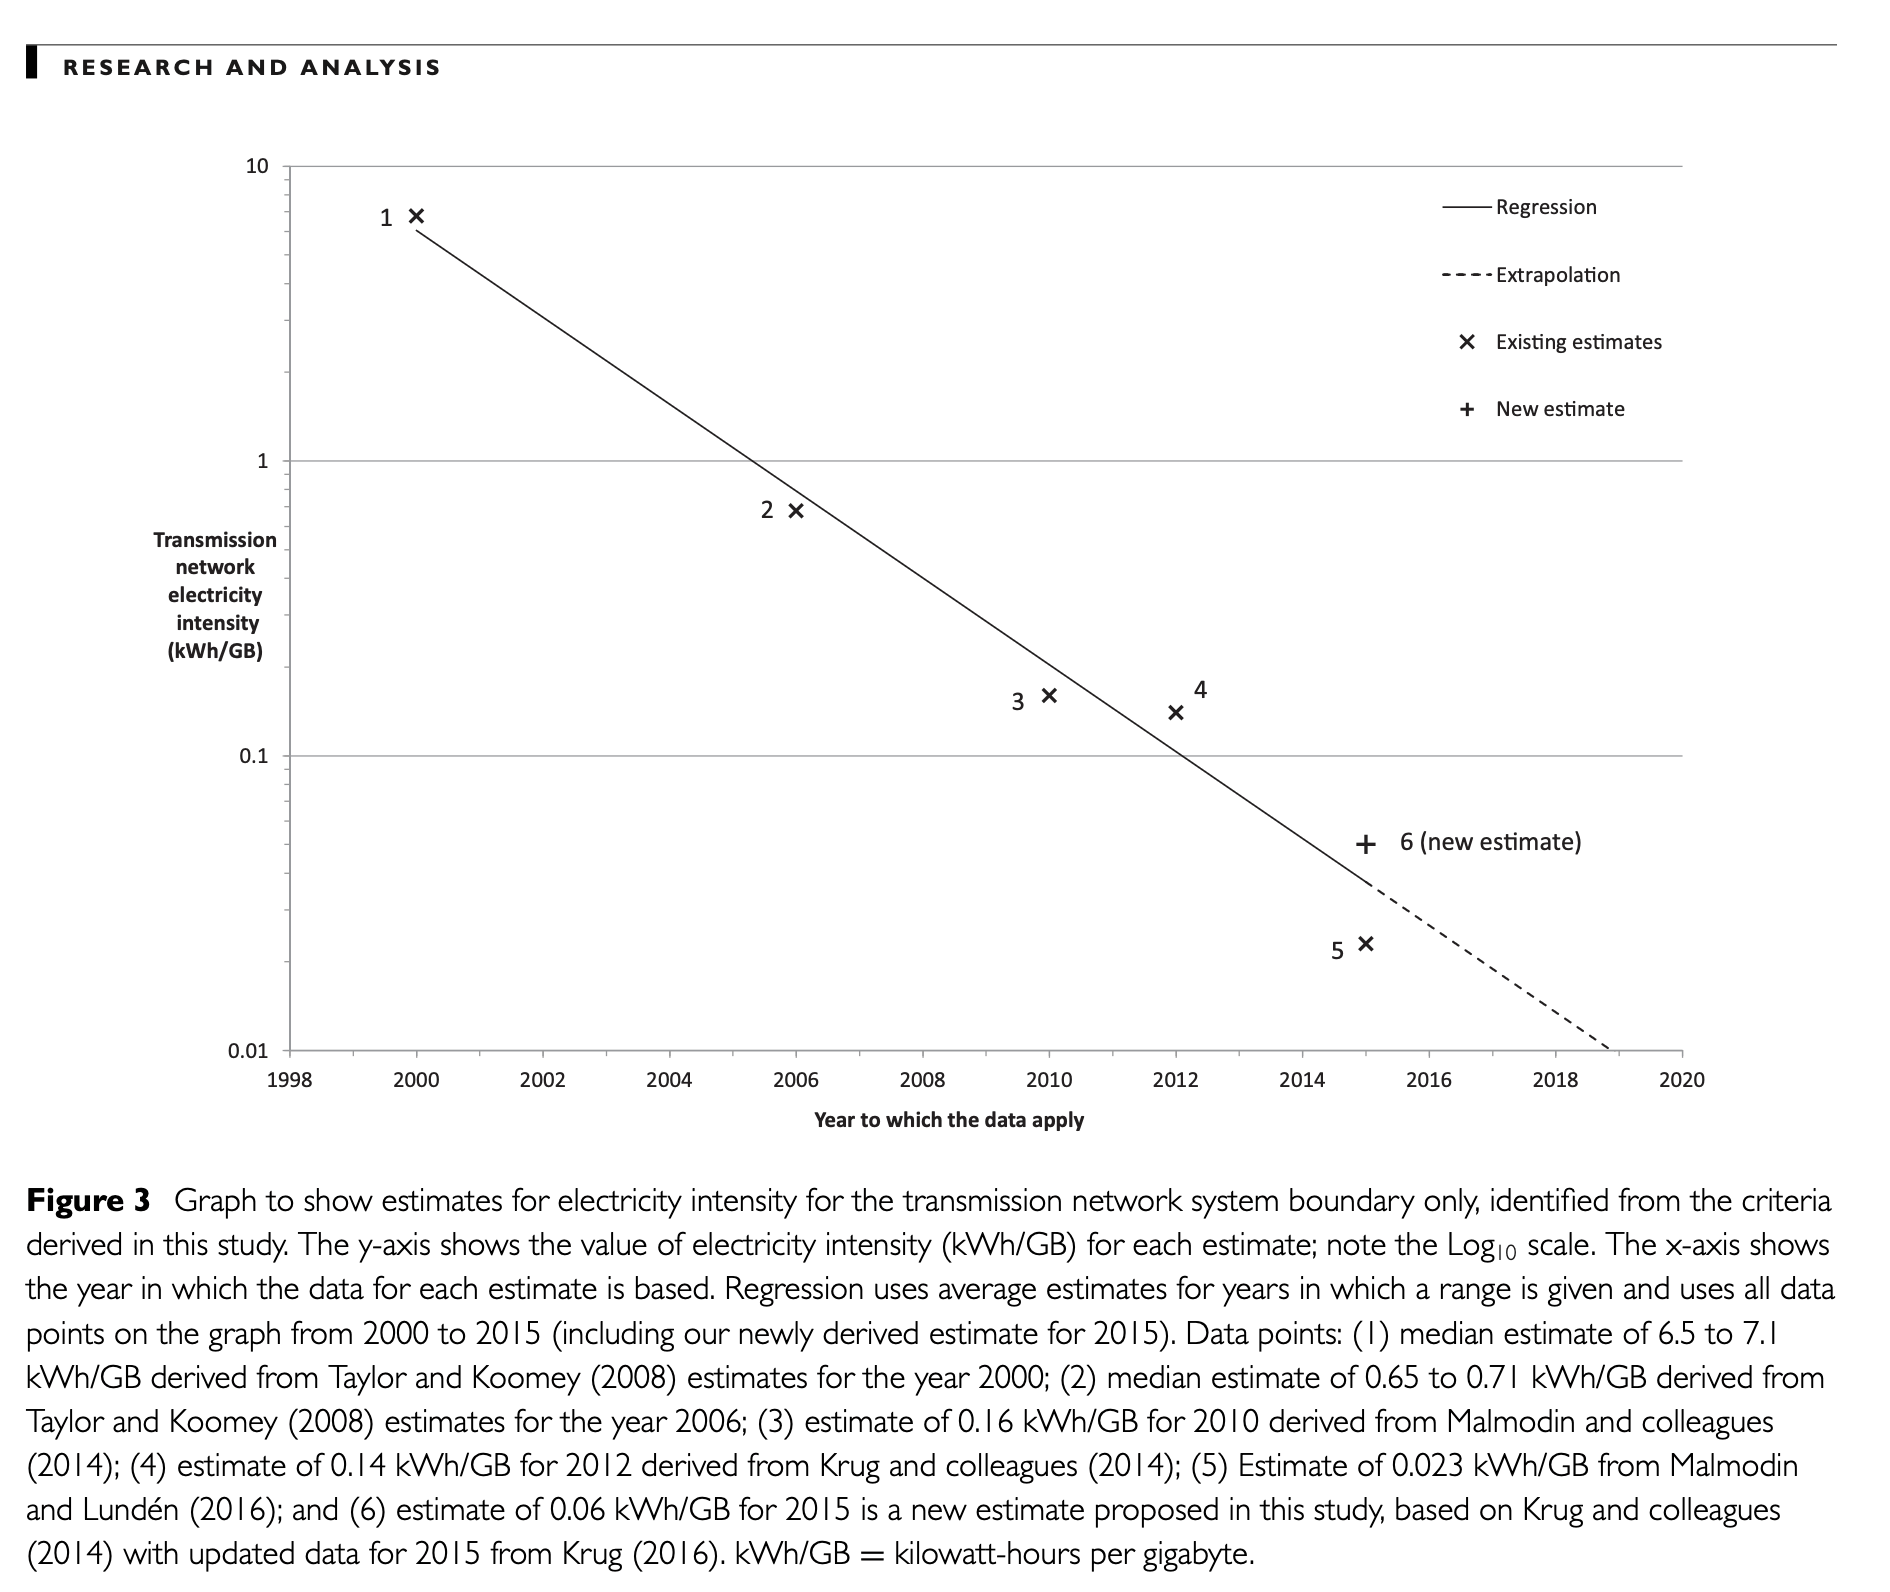
Joshua Aslan’s PhD thesis, available from 2020, added another data point on this trajectory that extended the line, but did not change the overall picture. From the conclusion of the paper, the authors note that:
Estimates for average transmission network electricity intensity that meet these criteria show a halving of intensity every 2 years. Our regression can be used to estimate Internet core and access network electricity use for each year between 2000 and 2015, helping to resolve previous uncertainty in this area. More research is required to update estimates for current and future years, and improve certainty of estimates and trends.
This historical trajectory was good news at the time – it meant that we could (probably) assume that the energy use of internet data transmission was decreasing and (probably) going to continue to decrease. The authors do not claim that the trajectory will continue – in fact, they note that “more research is required” for future years to understand trends. Well, a few years have passed since then, and new data sources have appeared that let us evaluate the hypothesis that the trend continued by halving every 2 years.
Australia’s national broadband network is operated by a government corporation called NBNCo. Recently, I discovered that they publish sustainability reports that include kWh/GB energy intensity figures for the Australian fibre-optic backbone network each year. This is really exciting news, because now we can test whether or not the energy intensity is still halving every two years. Similar to the NBNCo numbers, one of New Zealand’s fibre network operators, Chorus, which owns and operates about 60-70% of NZ’s fibre network, also discloses the same numbers. I’ve charted them together with the extended line from the Aslan et al. (2017) paper below.
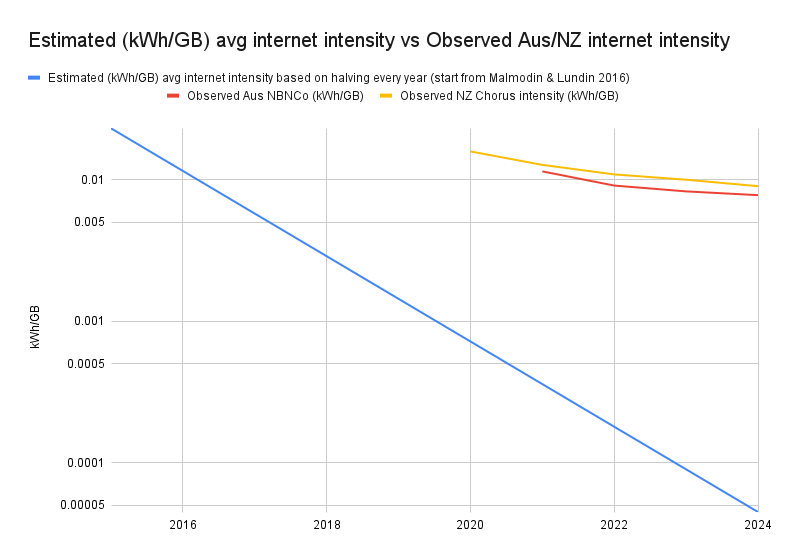
Ah. Hmm… okay. So something has changed since the late 2010s/early 2020s, as the observed Australian and NZ energy intensity metrics have diverged quite substantially from the "halving every 2 years" trajectory – with implications for how much energy (and, by extension, emissions) downloads come with. What's behind this change? Have download rates not gone up much, or has energy efficiency in the networks themselves stopped improving?
Here’s a partial chart of data volumes transmitted across the NZ Chrous network (in Petabytes) that gives us a hint.
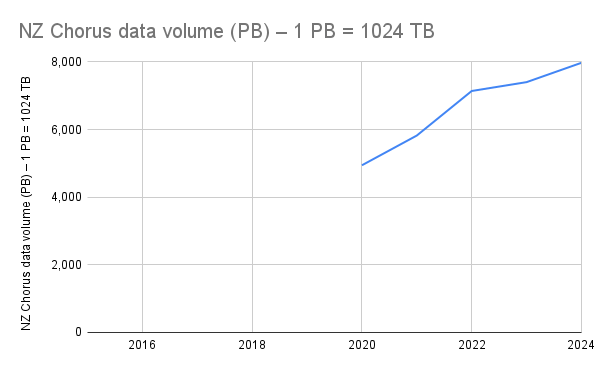
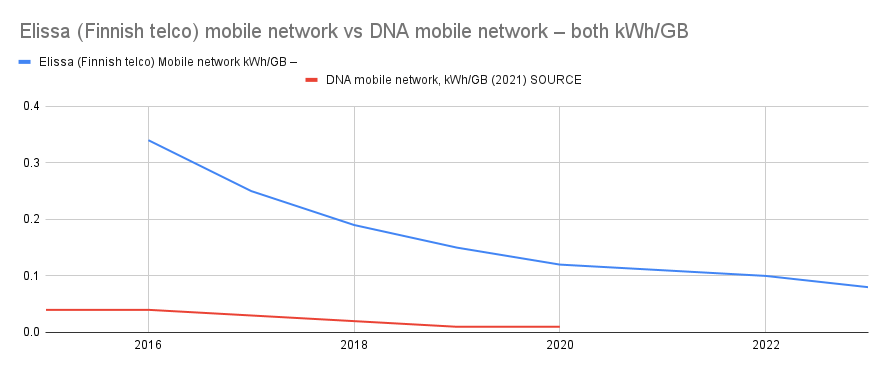
Data volumes are still growing! So, I suspect that we are probably reaching some sort of limit in internet switching hardware and its energy efficiency capacity. Alternatively, we could be between generational upgrades, or backbone providers are focusing on 5G network growth instead? Without more research, your guess is as good as mine. I hope it’s not because of a prioritisation of mobile transmission networks – here’s a chart of two Finnish mobile network providers and their energy intensity (kWh/GB). It’s about 3 orders of magnitude larger than the fixed internet intensity.
Okay, that’s an interesting diversion, but here’s where we get back to downloads and updates. Given the latest figures from NBNCo and Chorus, I feel relatively confident saying that digital downloads of games are a material part of the game industry’s GHG footprint – we cannot assume that downloads of game files and updates are "small" or even reducing. We can, however, use this type of data and others from local internet network providers in other countries to make somewhat more meaningful measurements of the GHG cost of installs and updates.
So we now have data sources for the amount of energy used when we transmit game files across the internet. But what about the other part of that system? What about data centre servers that have to retrieve game files from storage and send them across the internet? It’s incredibly hard to find figures for this – and initially my inclination was to leave it out entirely as “too hard”. Something to fix in a future iteration of the standard. But in the review session we did with the STRATEGIES WP3 team, Chris Paling & the team pushed back on it a little and suggested it might be an important part of the activity. So I went looking for any research that was out there on data centre file server processing.
I didn’t find a specific figure, disappointingly, but I did find two sources that I was able to combine for something like an estimate. The first thing to draw from is the IEA’s Energy and AI report, from April this year. In that report, the IEA compiled a total figure for global data centre energy use. That chart looks like this (on p.56):
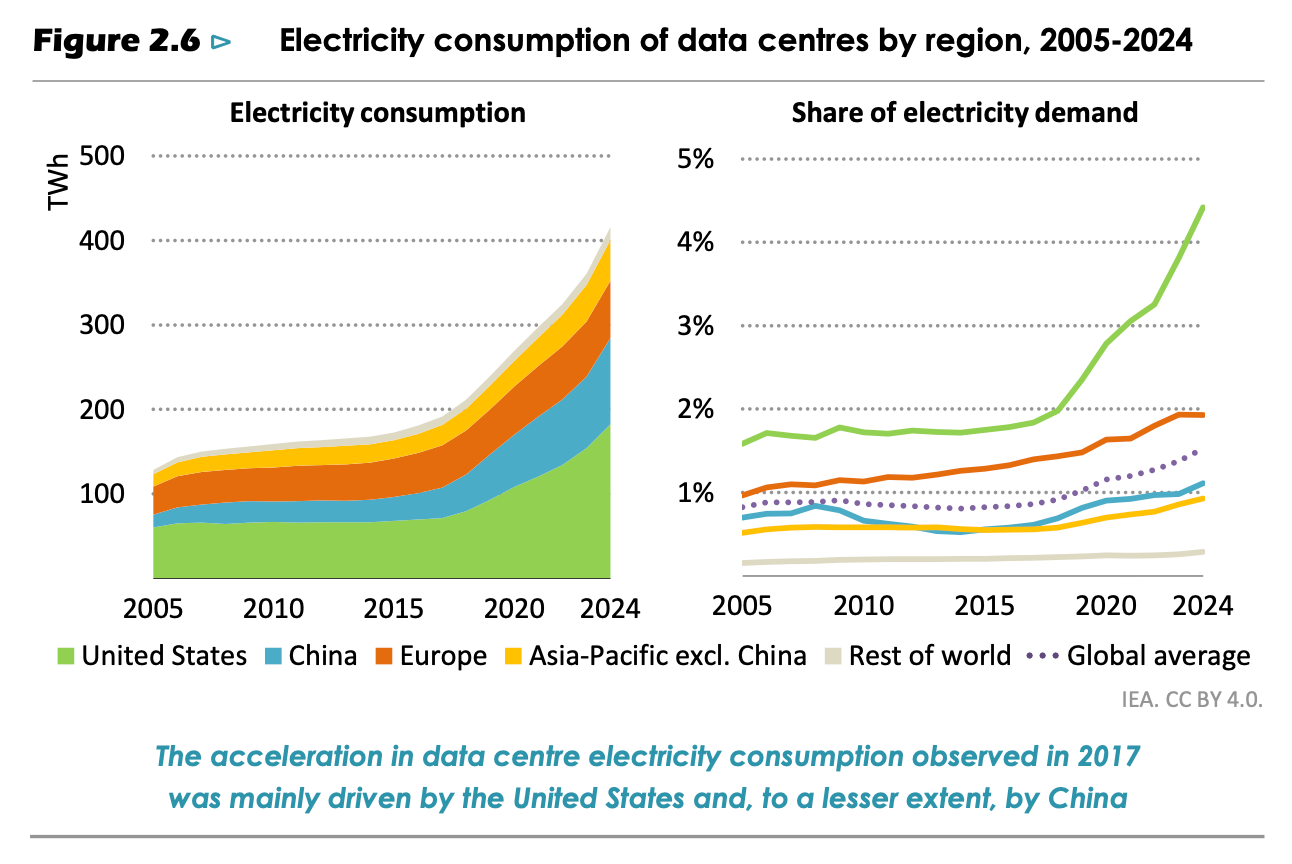
There’s the raw data in a supplementary file, so I grabbed that too. Next I found a report from the data centre industry organisation Knight Frank – their Data Centres Global Report 2025. Inside, they have a helpful (if slightly terrifying) graph of "Total data created, captured, copied, and consumed" in Zettabytes. I had to look up how big a zettabyte was.
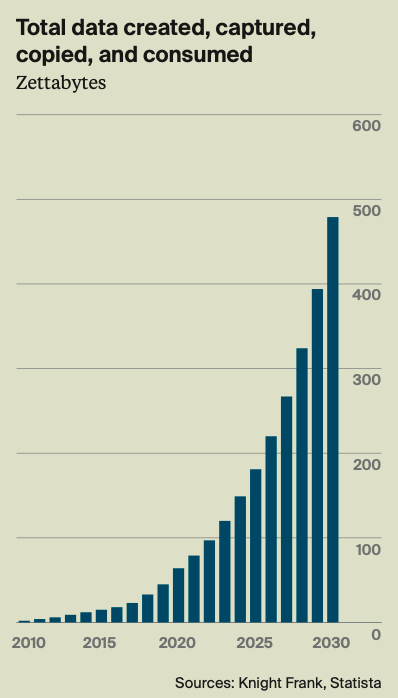
Now this surely includes a lot of other activities done by data centres beyond simply serving up files (particularly: energy-intensive AI), but hey, it’s a place to start. If we divide the total energy figure from the IEA by the total data figure from Knight Frank’s report, we get a very, very conservative baseline kWh/GB trend and something perhaps vaguely usable as a baseline for DC file server energy consumption.

It’s an overestimate - that’s guaranteed – but it seems within the realms of plausibility. It's also incidentally quite a similar rate to the mobile network energy intensity figures from Finland disclosed by two telcos there (though that's quite a different physical process – nevertheless, plausible). So that gives us a place to start and something to improve on for future measurement. It might also help to incentivise aiming for direct data sharing from the actual DC and edge network providers themselves, because they will almost certainly be lower.
So those are the sources for the two parts of the system – internet network and DC energy consumption (and GHG emissions) in the new S3.9 method.
There's still the third and final system component, which is the end user device. Here it’s important to note that we only want to account for energy used for downloading games onto the device (phone, console, PC, etc) when no game is actually running. This way we avoid overlap with the S3.11 component(s) of the standard which cover measuring emissions from gameplay. We're just talking about downloads outside the game, which also keeps it simpler.
Here, we just use a flat energy consumption figure that seems realistic for each platform. I haven’t come across any research yet on what downloading files does to energy consumption on specific devices, and my assumption is that it’s not a hugely energy-intensive activity (but maybe that’s not entirely accurate, given that there’s writing to SSDs involved?). The energy consumption figures we chose are: mobile device = 5 W, console device = 30 W, PC device = 100 W. These are a bit conservative; possibly the reality is a bit lower, but if research becomes available, we’ll update these figures in a revision. More research needed, as always!
But we also need to know how long a device spends downloading files – so we’ve gathered average download speeds from Ookla (the SpeedTest company), and we use that to get a pretty decent estimate of how long a device spends downloading an install or update in a given region. Users of the standard add up the total amount of data downloaded on each platform (e.g. on PS5 in Finland, or mobile phones in Poland) and from there, can divide the amount by the average download speed and get a good sense of the total time spent downloading across all devices on that platform.
Because of the high speed of internet downloads these days, even big downloads don’t take that long anymore, and so we’ve included some thresholds for when end-user device downloads become essential to include. For anything under the thresholds, the numbers just don’t work out to be meaningful. So, unless you have game files that are bigger than 100GB, or your audience is in the millions of players, then you don’t need to do the end user devices component of the Standard. That helps to keep things simple for smaller game companies, too. We'll update these thresholds too as things change, and in response to real-world experience and feedback.
And with that done, we’ve finished our measurements for S3.9 downstream transport and distribution! We’ve got energy and emissions from two use cases (download and updates) and three system components (data centres, internet backbone, and end devices) that make up the S3.9 downstream transport and distribution Standard.
Try it out yourself with your own Steam or App store export data, and let me know how you go! I would love to see your results.
Also, if you’re so inclined, you can help improve accuracy in this part of the standard by looking up your own local internet infrastructure kWh/GB figure in their sustainability report. You might have to know (or search for) the infrastructure provider, who might or might not be separate from your ISP, but if you know the company that maintains the fibre and cables, look them up and see what they're reporting. And if you find anything – please let me know! I’m very keen to see whether other countries are hitting the same efficiency limits as Australia and NZ.
That's all for now – thanks for reading Greening the Games Industry! If you liked this post and want to support the work we're doing, you can sign up to the SGA newsletter (scroll to the bottom of the page) to hear more about our work, or join us on the journey to a sustainable games industry.