Super Mario Sunshine: Nintendo’s 2019 CSR stuff up and Japan's Renewables mix

So there’s a pretty big error in my book that I was only recently made aware of. In Chapter 4 “How much energy does it take to make a videogame?” I gave Nintendo a pretty glowing review, as they seemed be purchasing an impressive 98% of their power from renewable sources. Here’s the relevant excerpt:
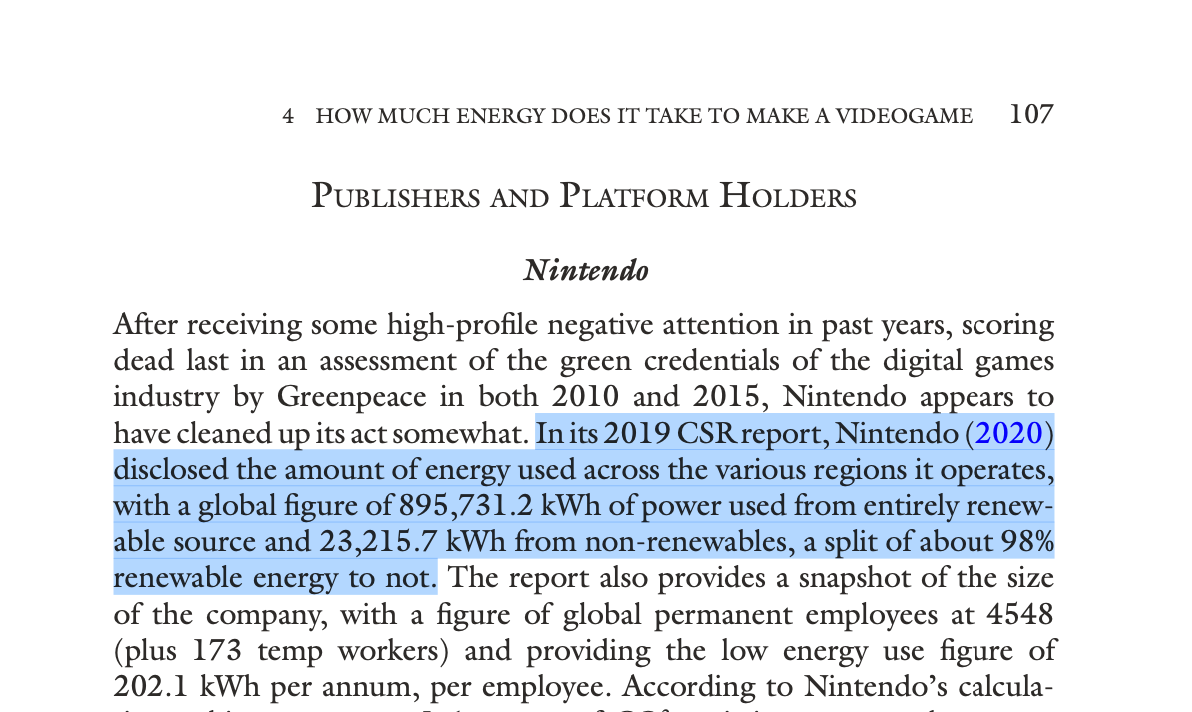
I did a series of tweets about about this the other week after some fact-checking by Lewis Gordon (who is writing a piece about my book and the games industry’s emissions for Wired). He wanted to know where these figures came from, which prompted me to go back and look again at the figures I had saved for Nintendo’s energy consumption and emissions. Nintendo’s disclosures (which I had saved as a PDF back in 2020) painted quite a different picture to what is currently in the live version on their website.
Here’s the version I saved on the 31st of August, 2020. Take note especially of the scale of units being measured:
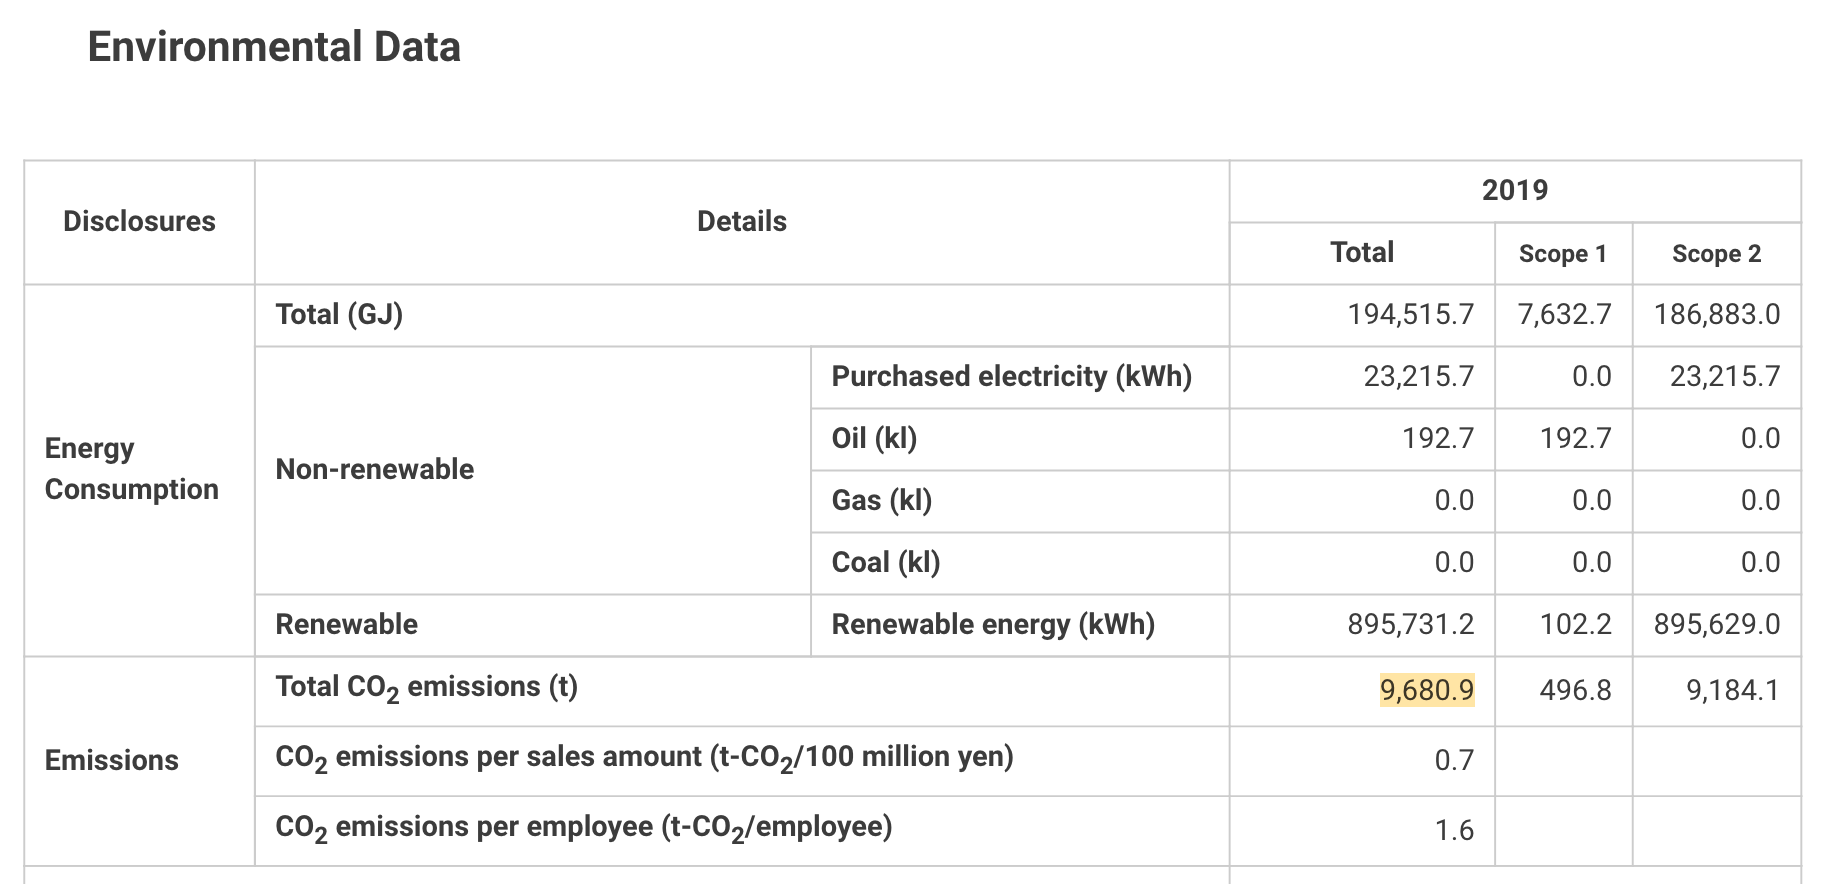
The two key figures are 895,731.2 kWh from renewables, and 23,215.7 kWh from non-renewables. Now compare that to the live version (screenshot taken on 5th May 22):
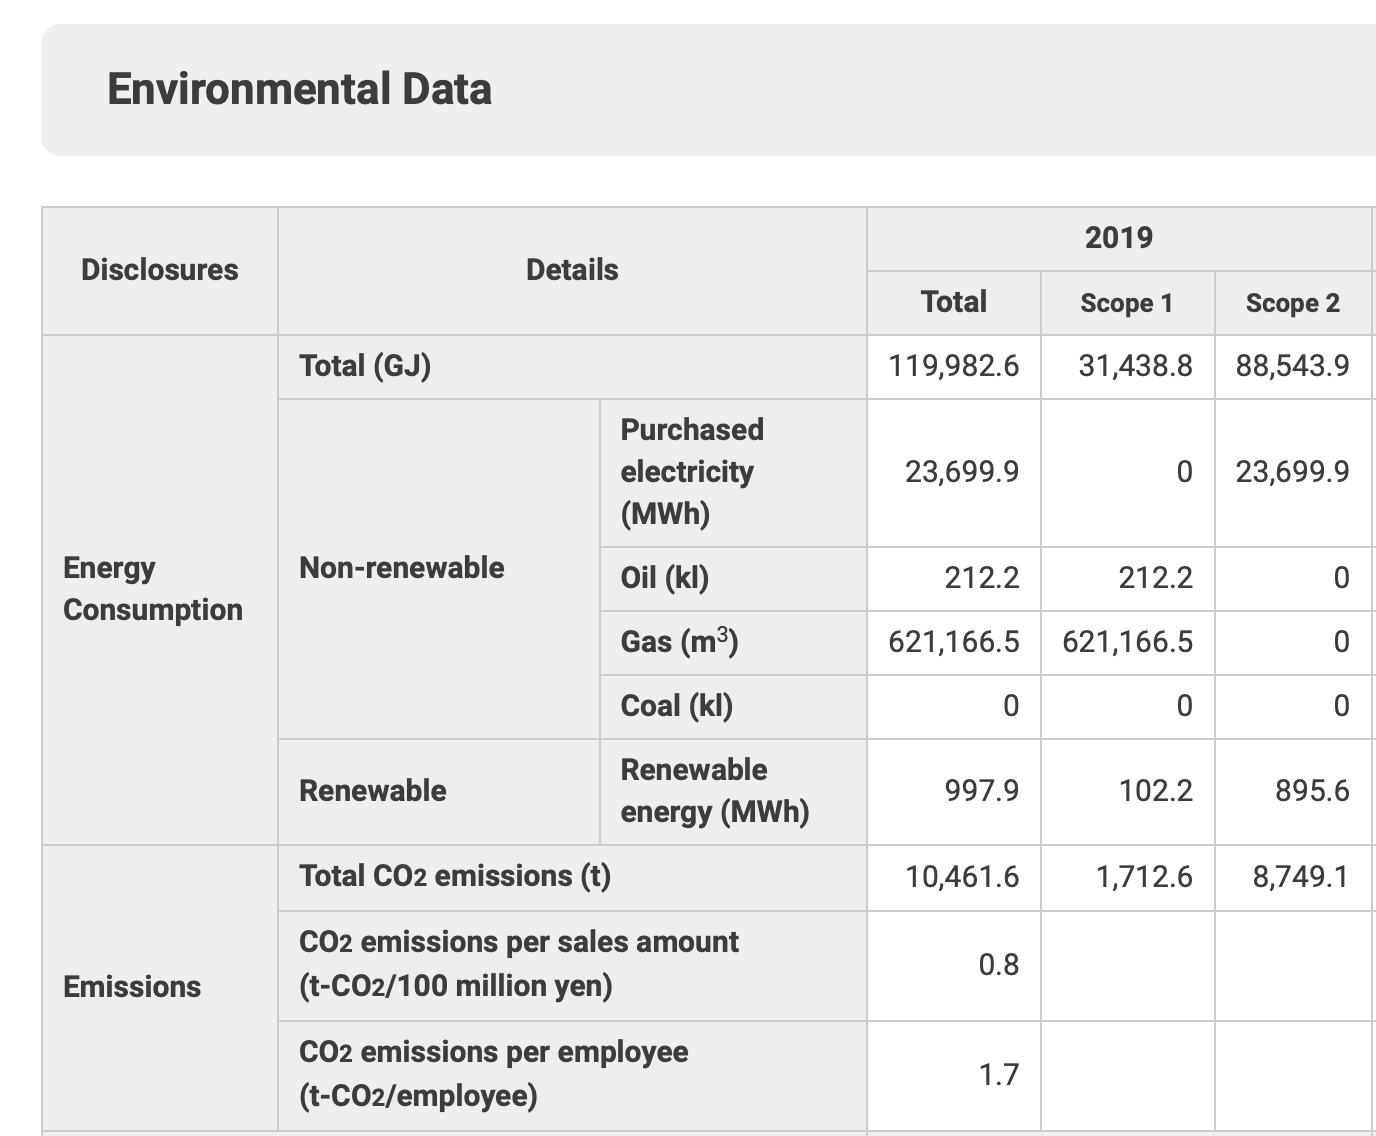
A few things have changed, but the key one is that non-renewable figure of 23,215.7 is now actually measured in megawatt hours (MWh) – 1000x larger than when measuring kilowatt hours (kWh). This is a bit of an oopsie daisy moment, someone’s got their sums wrong and they’ve clearly updated it to fix the error since – but its an easy mistake to make. How easy? Well easy enough that in the very same chapter I suggested that it was very likely that Electronic Arts did almost exactly the same thing. In their 2020 impact report they disclosed a figure of 93.31 MWh of annual electricity use – which seemed a bit small for a company their size.
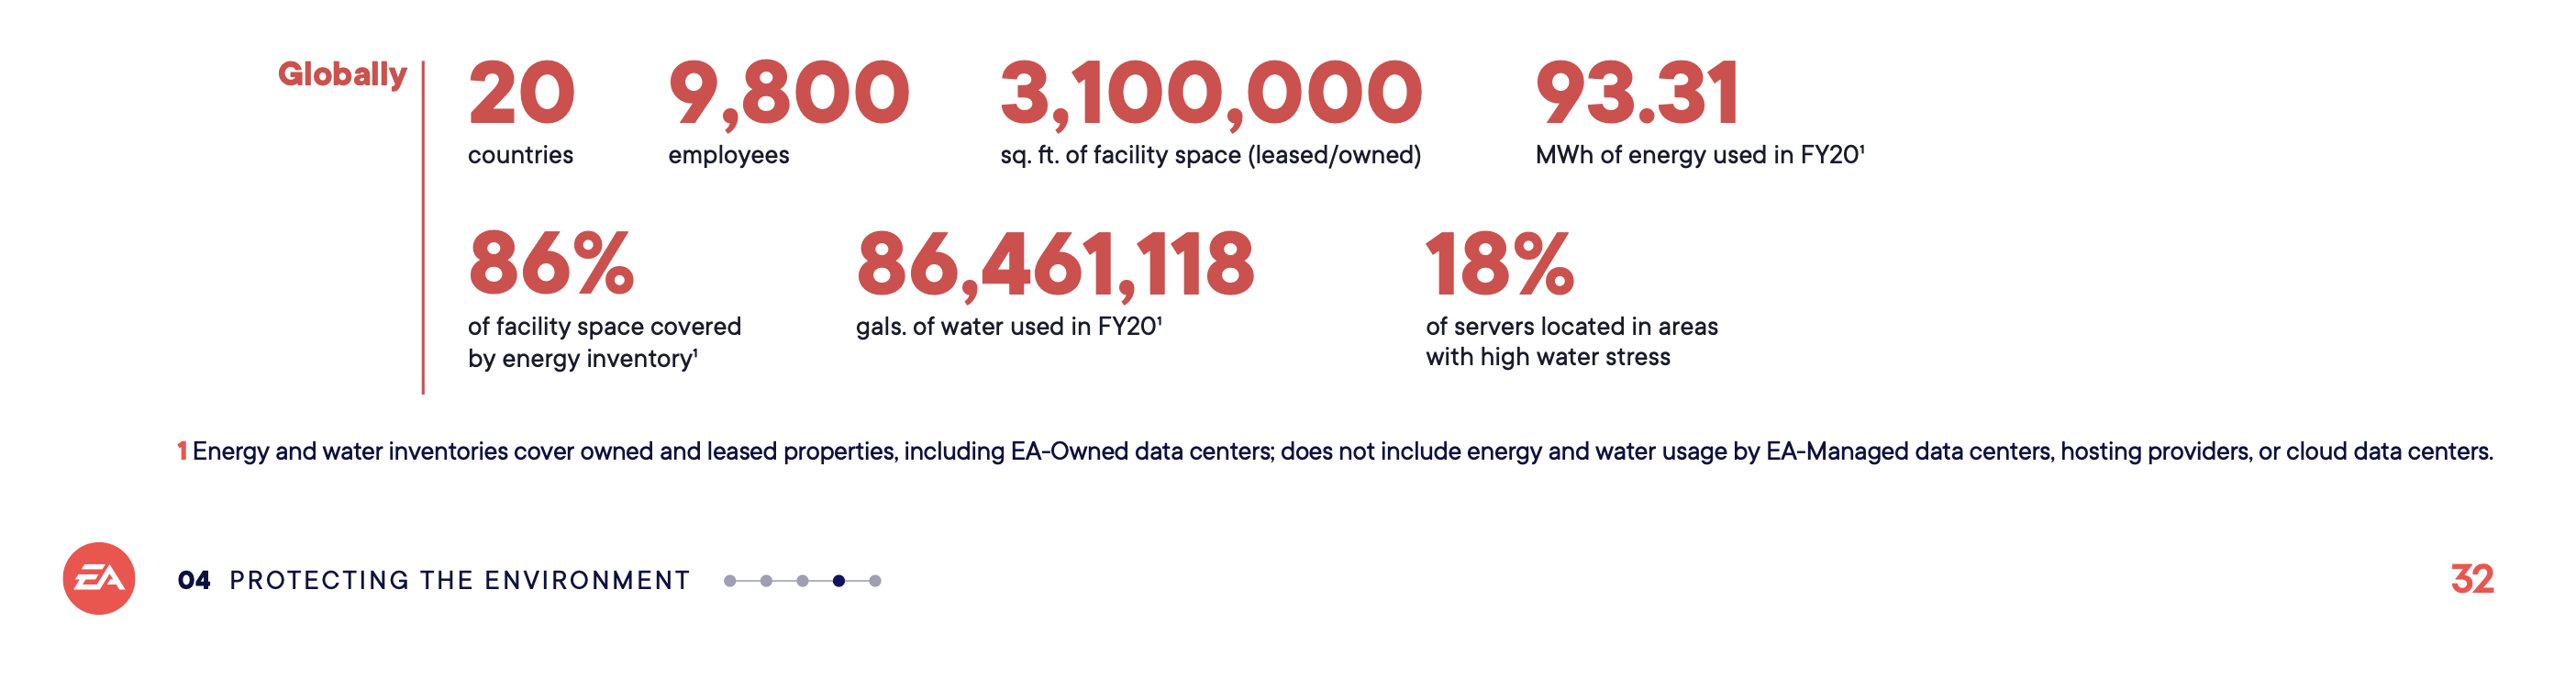
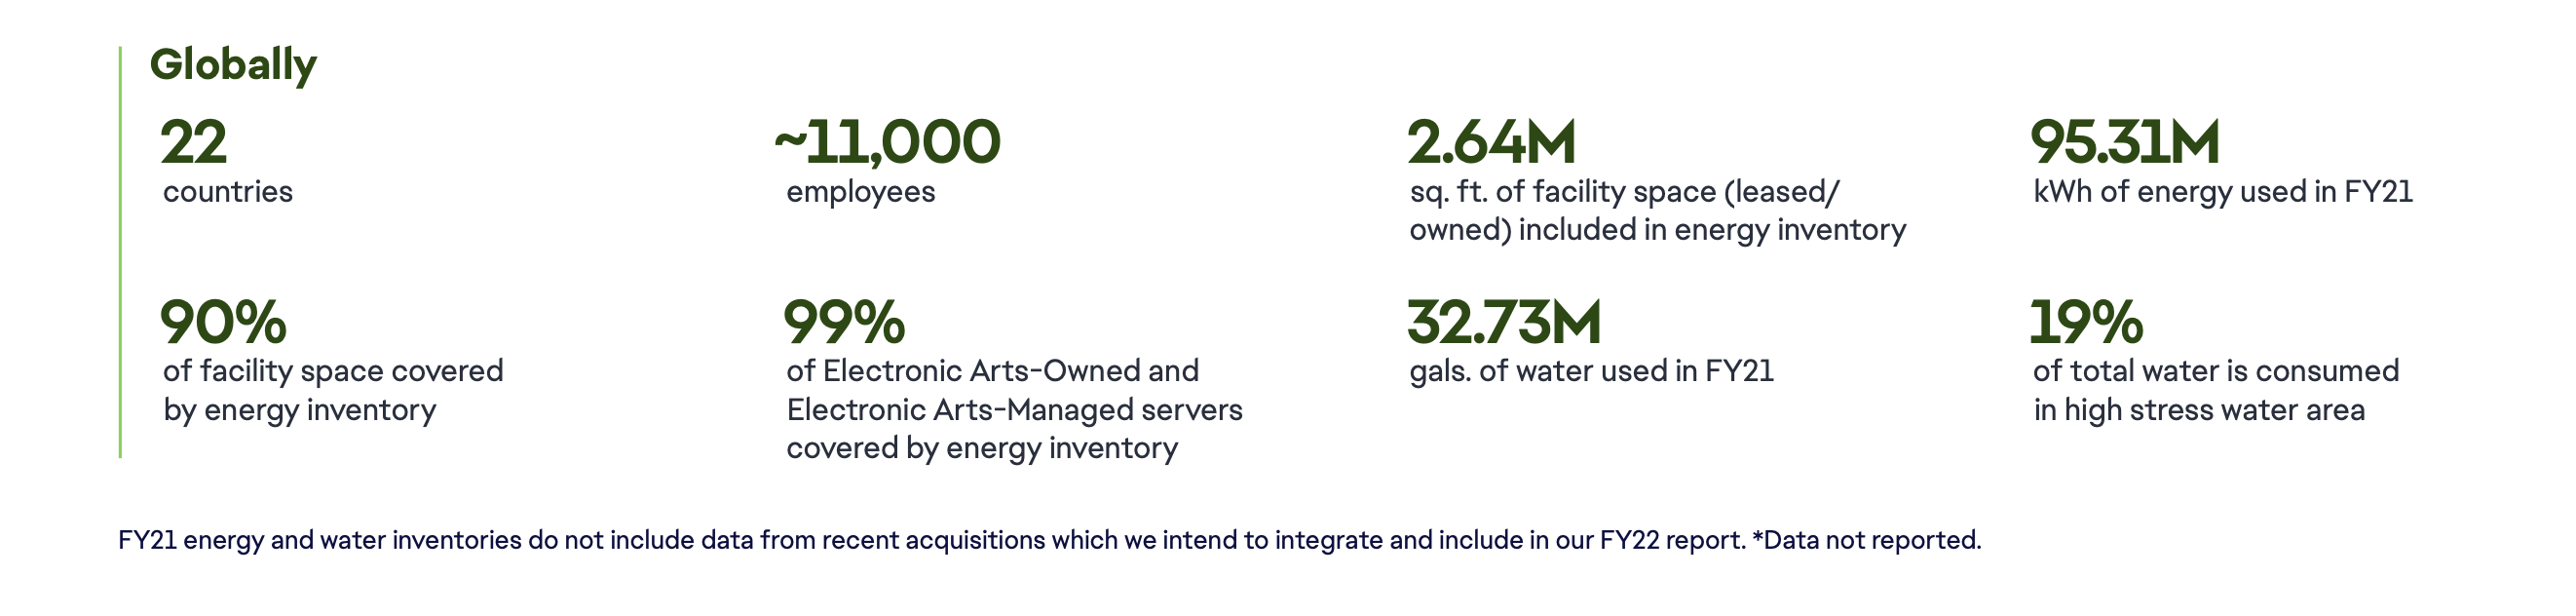
At the time I was writing, I queried their investor relations email address and received no response about the accuracy of the figure, which is a shame. However, come the release of the 2021 impact report, there’s now some good evidence that they’ve did almost the exact same thing as Nintendo (though without updating the 2020 report), as annual power consumption is no longer measured in MWh, but millions of kWh (1 MWh is only 1000 kWh not 1,000,000 kWh – which makes their 2020 figure wrong by a factor of 1000).
We can conclude a few things from this. The first is not a flattering conclusion about how high of a priority these companies are placing on their ESG disclosures. If two of the biggest games companies in the world aren’t even getting the numbers right, that’s not an encouraging indication of how seriously they are taking this. The second, however, and perhaps more generous reading, is that it’s simply an easy mistake to make when working with big numbers, especially for those unfamiliar with power and emissions figures.
It’s especially a problem when swapping between different units or scales of account. In both cases I think the consequences of getting these figures wrong here were fairly minor, but if Nintendo and EA were using these numbers to arrive at emissions figures, which they were then purchasing carbon offsets for this would likely have a very real financial implication, in this case drastically under-compensating for actual emissions, and threatening the credibility of their corporate claims. Similarly, doing the reverse and overestimating by a factor of 1000 would see it become prohibitively expensive.
So here’s my advice – if you use kWh in one place, try and stick with it everywhere. If you use MWh, try and stick with that, even at the cost of some precision (though you can always add more numbers after a decimal point). Once you’ve done all your calculations in the same unit, for your final ESG reporting then you might be able to turn these into neater looking, more convenient units for communication and disclosure (though double and triple checking will still be important). If organisations don’t have a clear process, or someone with some experience in this field on staff, they risk running into the same issue.
Another conclusion from this, however, is that unconscious expectations can prevent you from seeing an obvious error. In the case of EA, what tipped me off to it was actually a claim elsewhere in their 2020 impact statement that said they had found reductions in electricity consumption on the order of 500,000 kWh (i.e. 500 MWh). How could a company reduce their consumption by more than 5 times the remaining consumption just by changing light bulbs? It doesn’t add up.
Why didn’t I notice the same thing with the Nintendo numbers? Aside from lacking some of the other contextual clues like a similar claim to an outsized reduction by Nintendo, perhaps a substantial issue is that I had an expectation about emissions intensity in the back of my mind, based on a trip to Japan in August 2019. One of the things that surprised me the most was how many solar farms I saw, both from the air flying into Tokyo, and out the window of the Shinkansen.

And it wasn’t just solar either – there was a very prominent wind farm right along the edge of the coastline. There’s no wind installation anywhere in Australia this close to a densely populated area. It was a real shock.

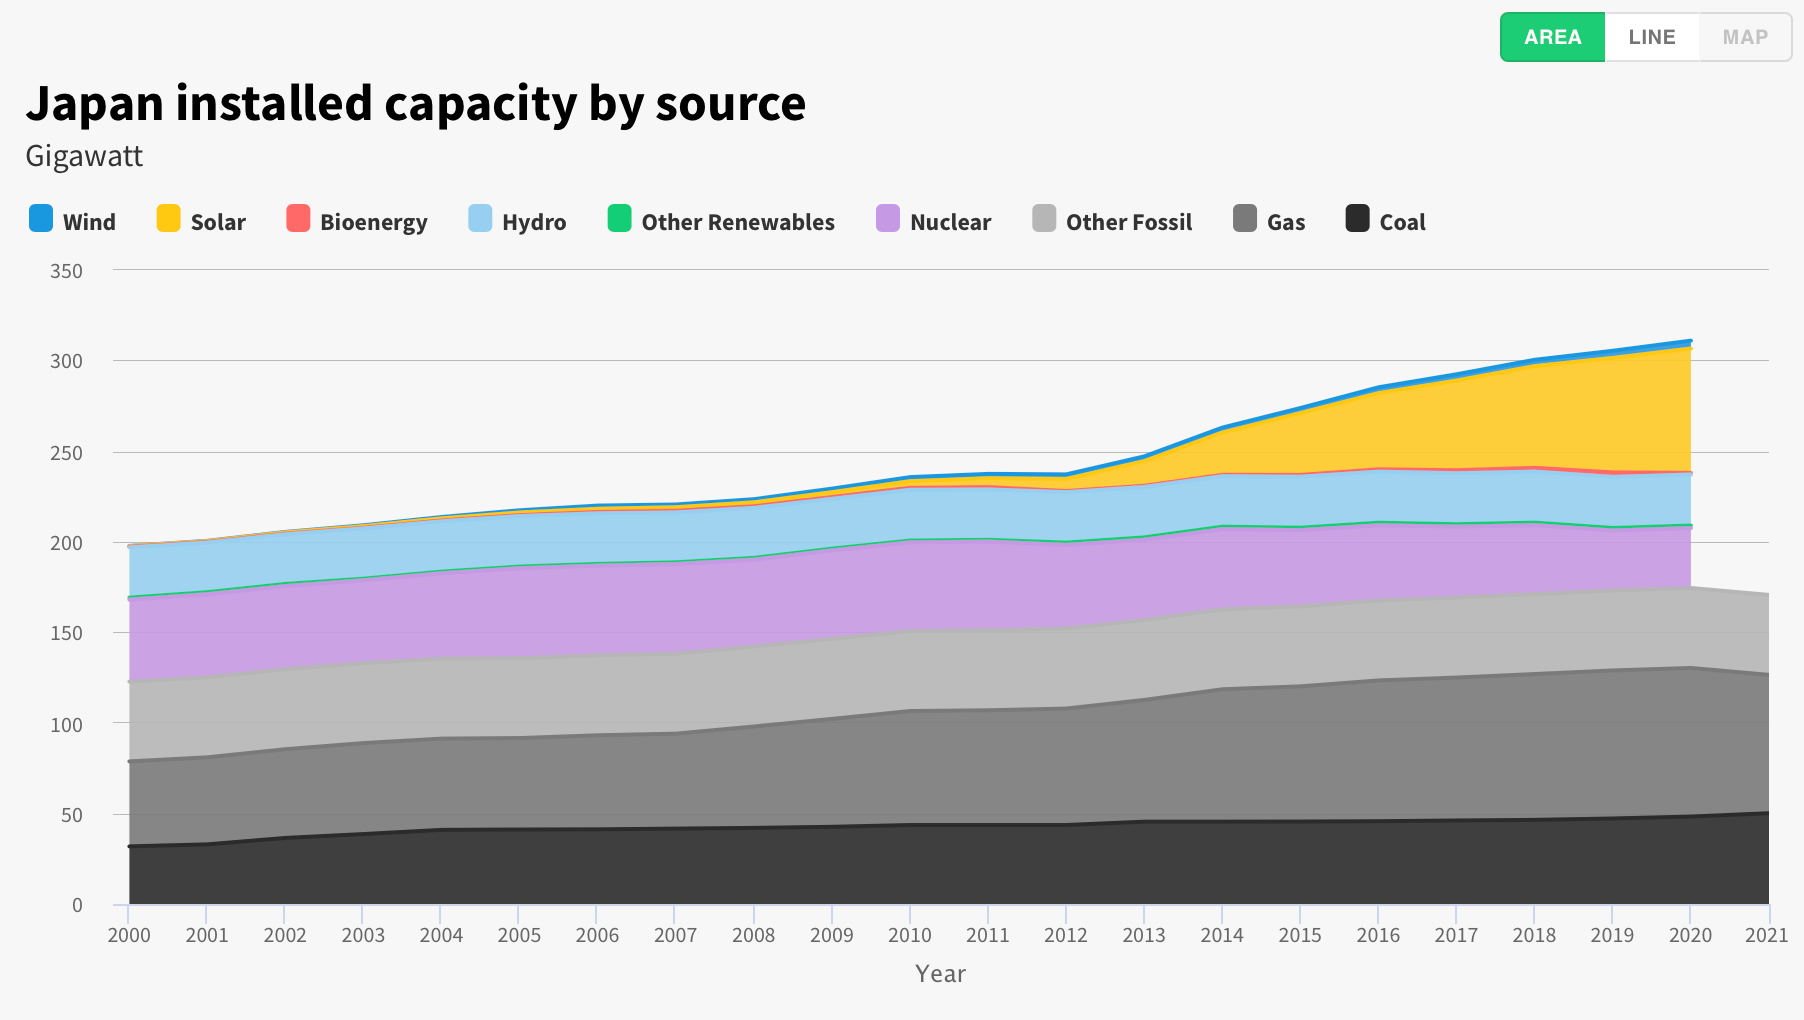
I love the sight of wind turbines, and have visited a few up close, both on organised tours and just while stopping at the side of the road. I think they’re absolutely stunning feats of modern engineering – and close to landscape art at times. So I was primed to expect, I think, a rosy picture of the Japanese energy market and its energy mix, with plentiful renewables already visible. However, despite the good progress that’s been made over the past decade, that isn’t an entirely accurate picture. A quick look at charts of the Japanese energy mix by fuel source makes it clear that the country is still a long way from being 100% renewable.
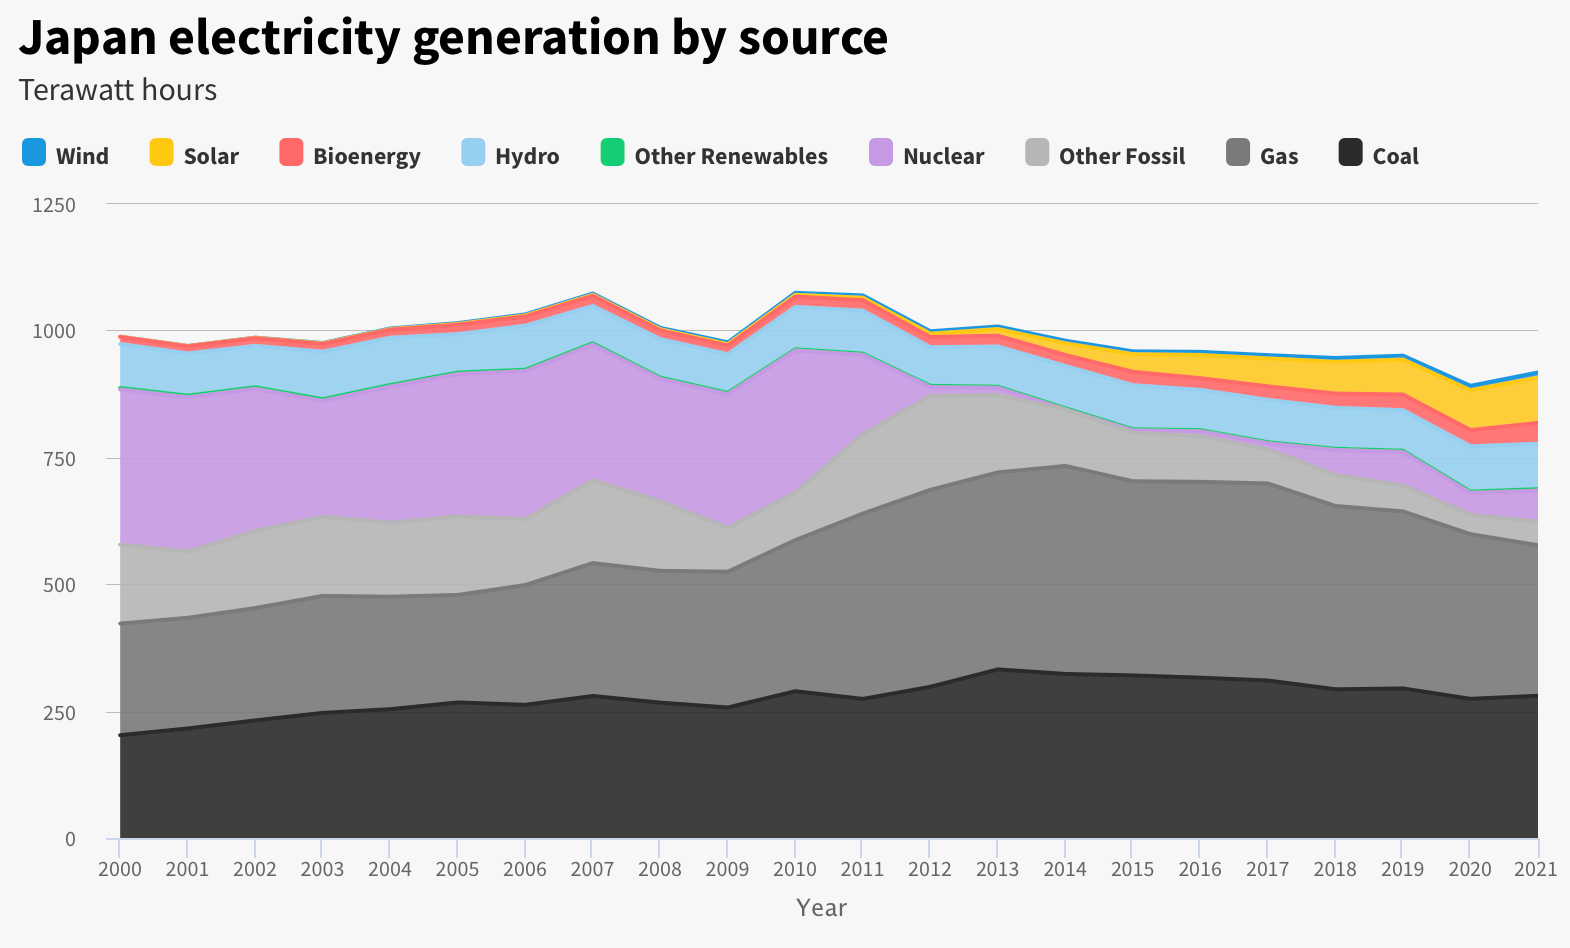
The main story here (and one which I am very conflicted about, in truth) is the near-total drop-off in nuclear power following the 2011 earthquake. Nuclear generation was between 25 and 30% of the countries generation prior to 2011, and the shutdown of the entire industry left a substantial hole in the grid, and real challenges for meeting the country’s energy needs. For the most part, coal and gas met the shortfall in the years immediately following, which pushed up their emissions for those years.
Thankfully, solar and wind quickly began to close the gap, as we can see from the installed solar and wind capacity figures below.
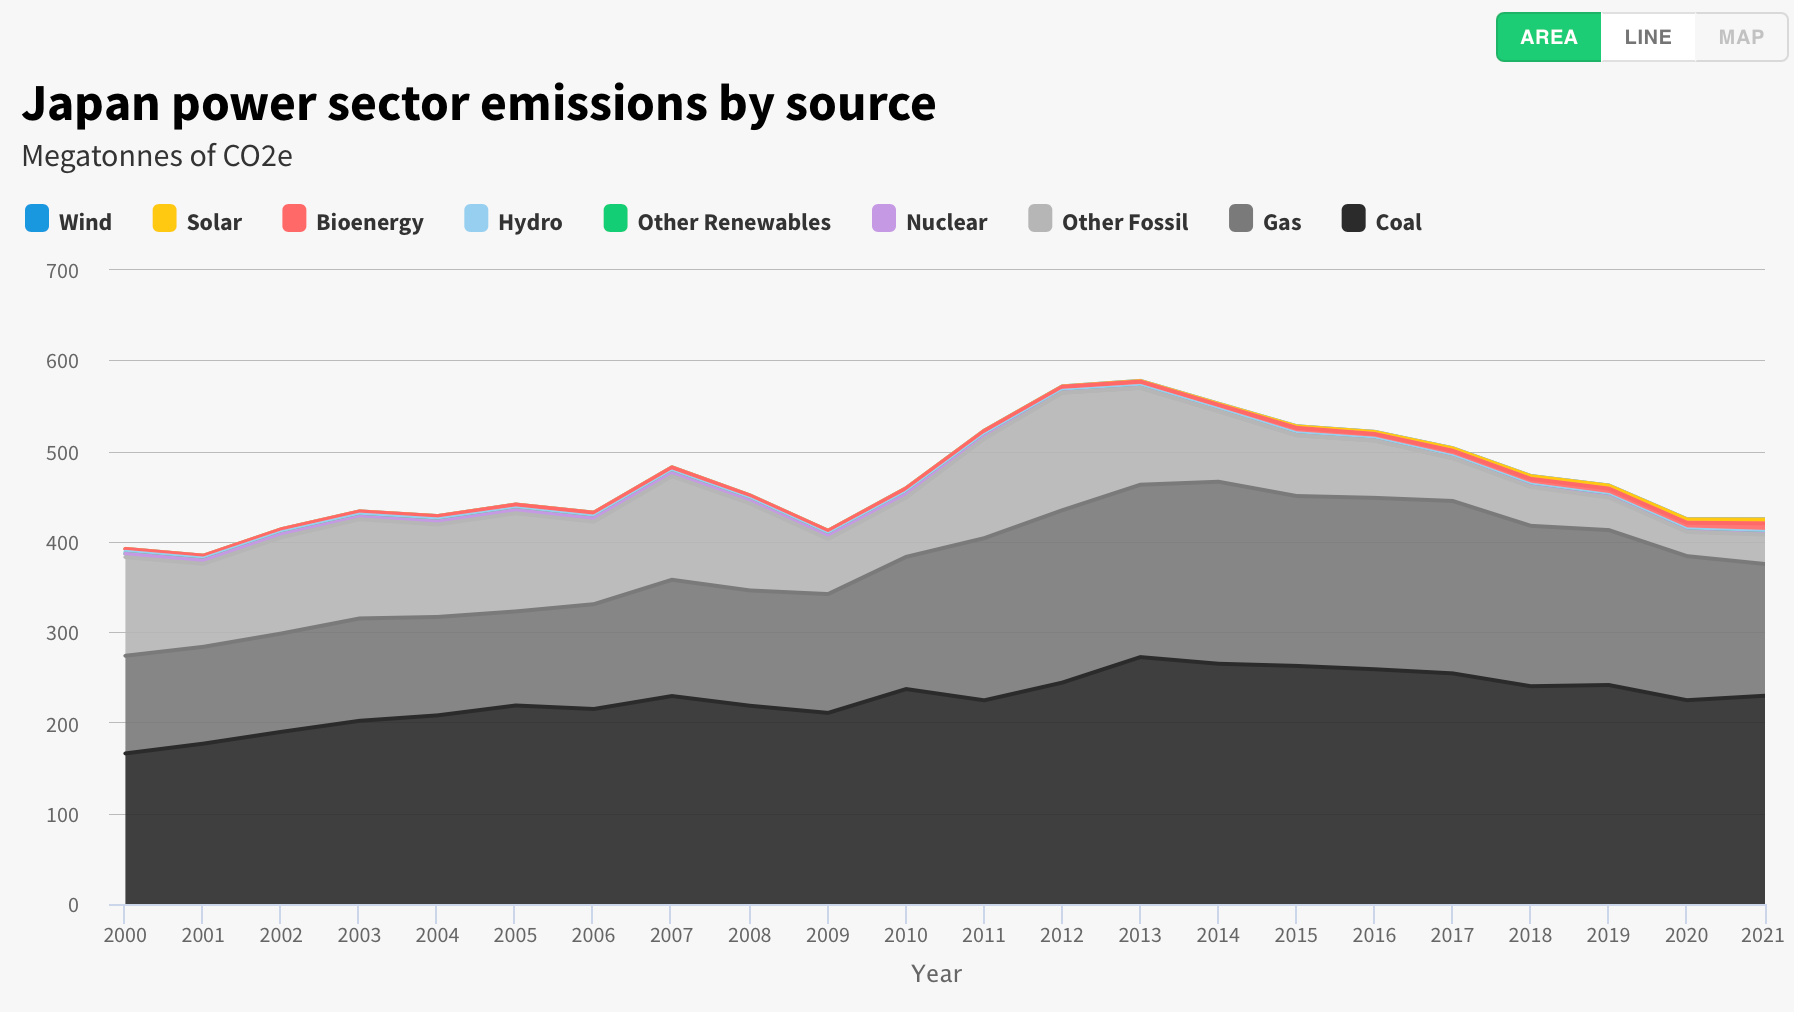
The extremely slow restart of the nuclear industry has also been a drag on power generation emissions, even as they have begun to finally decline. The 2011 disaster and the energy shock it caused quite obviously spurred the huge investments in solar and wind which I saw from the air. This story is now being repeated in Europe in the wake of the war in Ukraine and high Russian oil and gas prices. Adam Tooze did a fantastic post over at Chartbook (my absolutely favorite, must-read newsletter by the way) back in March, on the mind-boggling size of EU investments now lining up to reproduce a similar transition in continental Europe.
Today, renewables account for about 20% of Japan’s total energy mix (though these numbers hide some of the complexity of real-time generation, duck curves, load balancing issues, etc). However, emissions and generation are both trending downwards, and I strongly suspect this is also the dividend of an increasing efforts to focus on energy efficiency. Total energy demand declined from its peak in 2011 each year since (aside from the 2020 dip and 21 rebound).
The emissions context for the power that Japanese game developers purchase is not too far off the pace of much of the rest of the developed world – though there is a long way to go to catch up with somewhere like, say California which is regularly seeing 90%+ renewables. Nintendo’s share of purchased renewables jumped enormously from the first year it began reporting in 2019, going from just 4%, to 30% of is power needs in 2020. This and other initiatives (more energy efficient lighting and buildings perhaps?) saw the per-employee, per-annum emissions nearly halve, from 1.7 tonnes to 0.9 tonnes of CO2. Change is happening, all across the industry, and at a pace that was almost unthinkable a few years ago – but we also have absolutely no time to lose, either.
I'm currently in the process of moving GTG to a new hosting solution as my previous one was not letting me send emails to any subscribers. Until this transition is complete, the site is currently at a temporary URL and there may be a couple of other teething issues as I get it all sorted and working smoothly. I had intended to send this post out earlier in the week but dealing with the hosting and email issues prevented it. Thanks for you patience!