What do high FPS, high graphics settings do to console energy consumption?


Console gaming has gotten much more sophisticated in the past decade. Not only are there more consoles and console sub-generations that people are playing across, but the TV screens they’re plugged into vary more as well. We have HD & 4K resolutions, high-dynamic range (HDR) output options, and high Hz refresh rates that console games are increasingly accomodating. The jump from HD to 4K screens is one I’ve focussed on a bit in the past – in one of the earliest posts I ever wrote for the newsletter I presented evidence for why 8K screens will never be necessary in a normal living room, giving us a useful line to step back from and avoid committing developer resources and minimising unnecessary energy demand. As I argued there, 8K suffers from hugely diminishing returns for most people with ordinary human vision, and I haven’t seen anything that challenges that.
With greater power under the hood in the latest console generation, along with the proliferation of the output options, many console games have introduced graphics settings to cater to different audiences preferences. For instance, in the game I play most often Destiny 2 I use a 120Hz output mode for the crucible (a competitive multiplayer mode). To hit this FPS target, a number of visual compromises are made, including I suspect rendering at a slightly lower output resolution (I’ve taken some screenshots for comparisons below). I also notice when this high Hz mode kicks in because my screen goes dark briefly as it changes mode. I’m happy to accept some graphical corners getting cut (even resolution scaling!) as the additional smoothness of 120 Hz gives me a slight edge over playing in standard 60FPS mode during the most frantic of situations, with rapid turns and fast movements.
After the stunning results of the Xbox end-user energy measurement tools shown at GDC this year, as well as being partly inspired by other (as yet unpublished) testing on the effects of different graphics modes on end user energy demands, I decided to break out the wall socket energy meter and do some testing for myself.
This week I looked at two games and their graphics options, playing them while monitoring their power draw to see whether I could identify a noticeable increase or decrease based on high FPS vs high visual fidelity options: The Witcher 3 and Destiny 2.
The testing setup
I played both games on a PS5 – model number CFI-1002B (a 2020 launch model, digital only PS5). The console output to an LG C2 65” TV (I think either the 2020 or 2021 model) which is a 4K OLED display, that can do variable refresh rate (though I still don’t think that’s enabled on the PS5) and HDR. This TV is perhaps my most prized possession, easily one of the best screens I have ever laid eyes on. It is bonkers how good this thing is for gaming and movies. /end plug
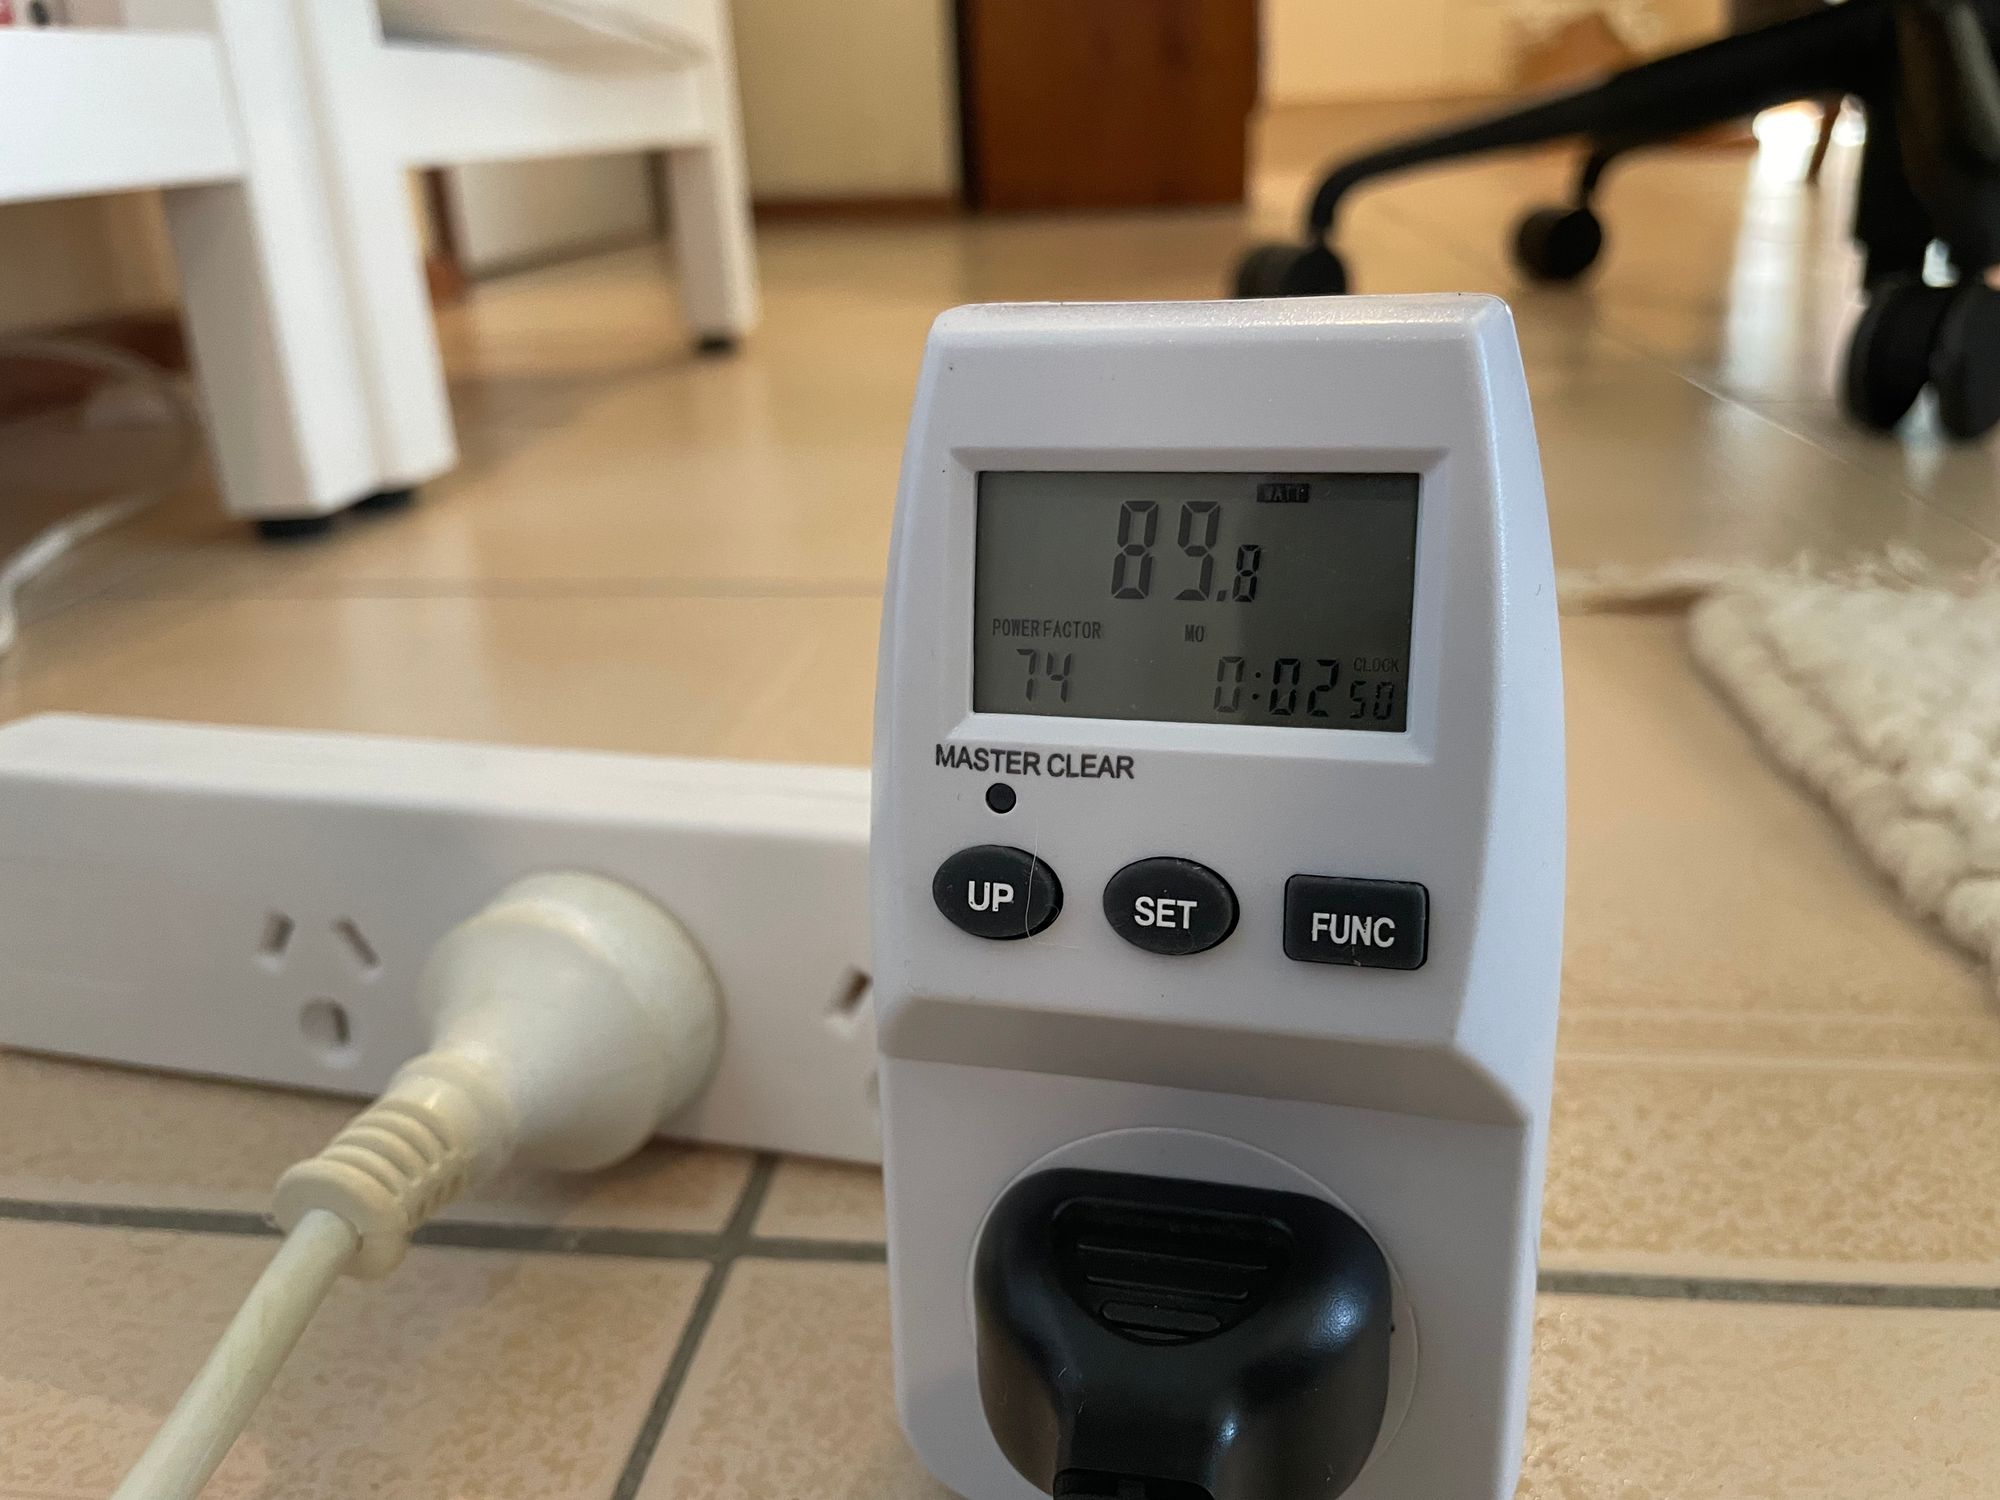
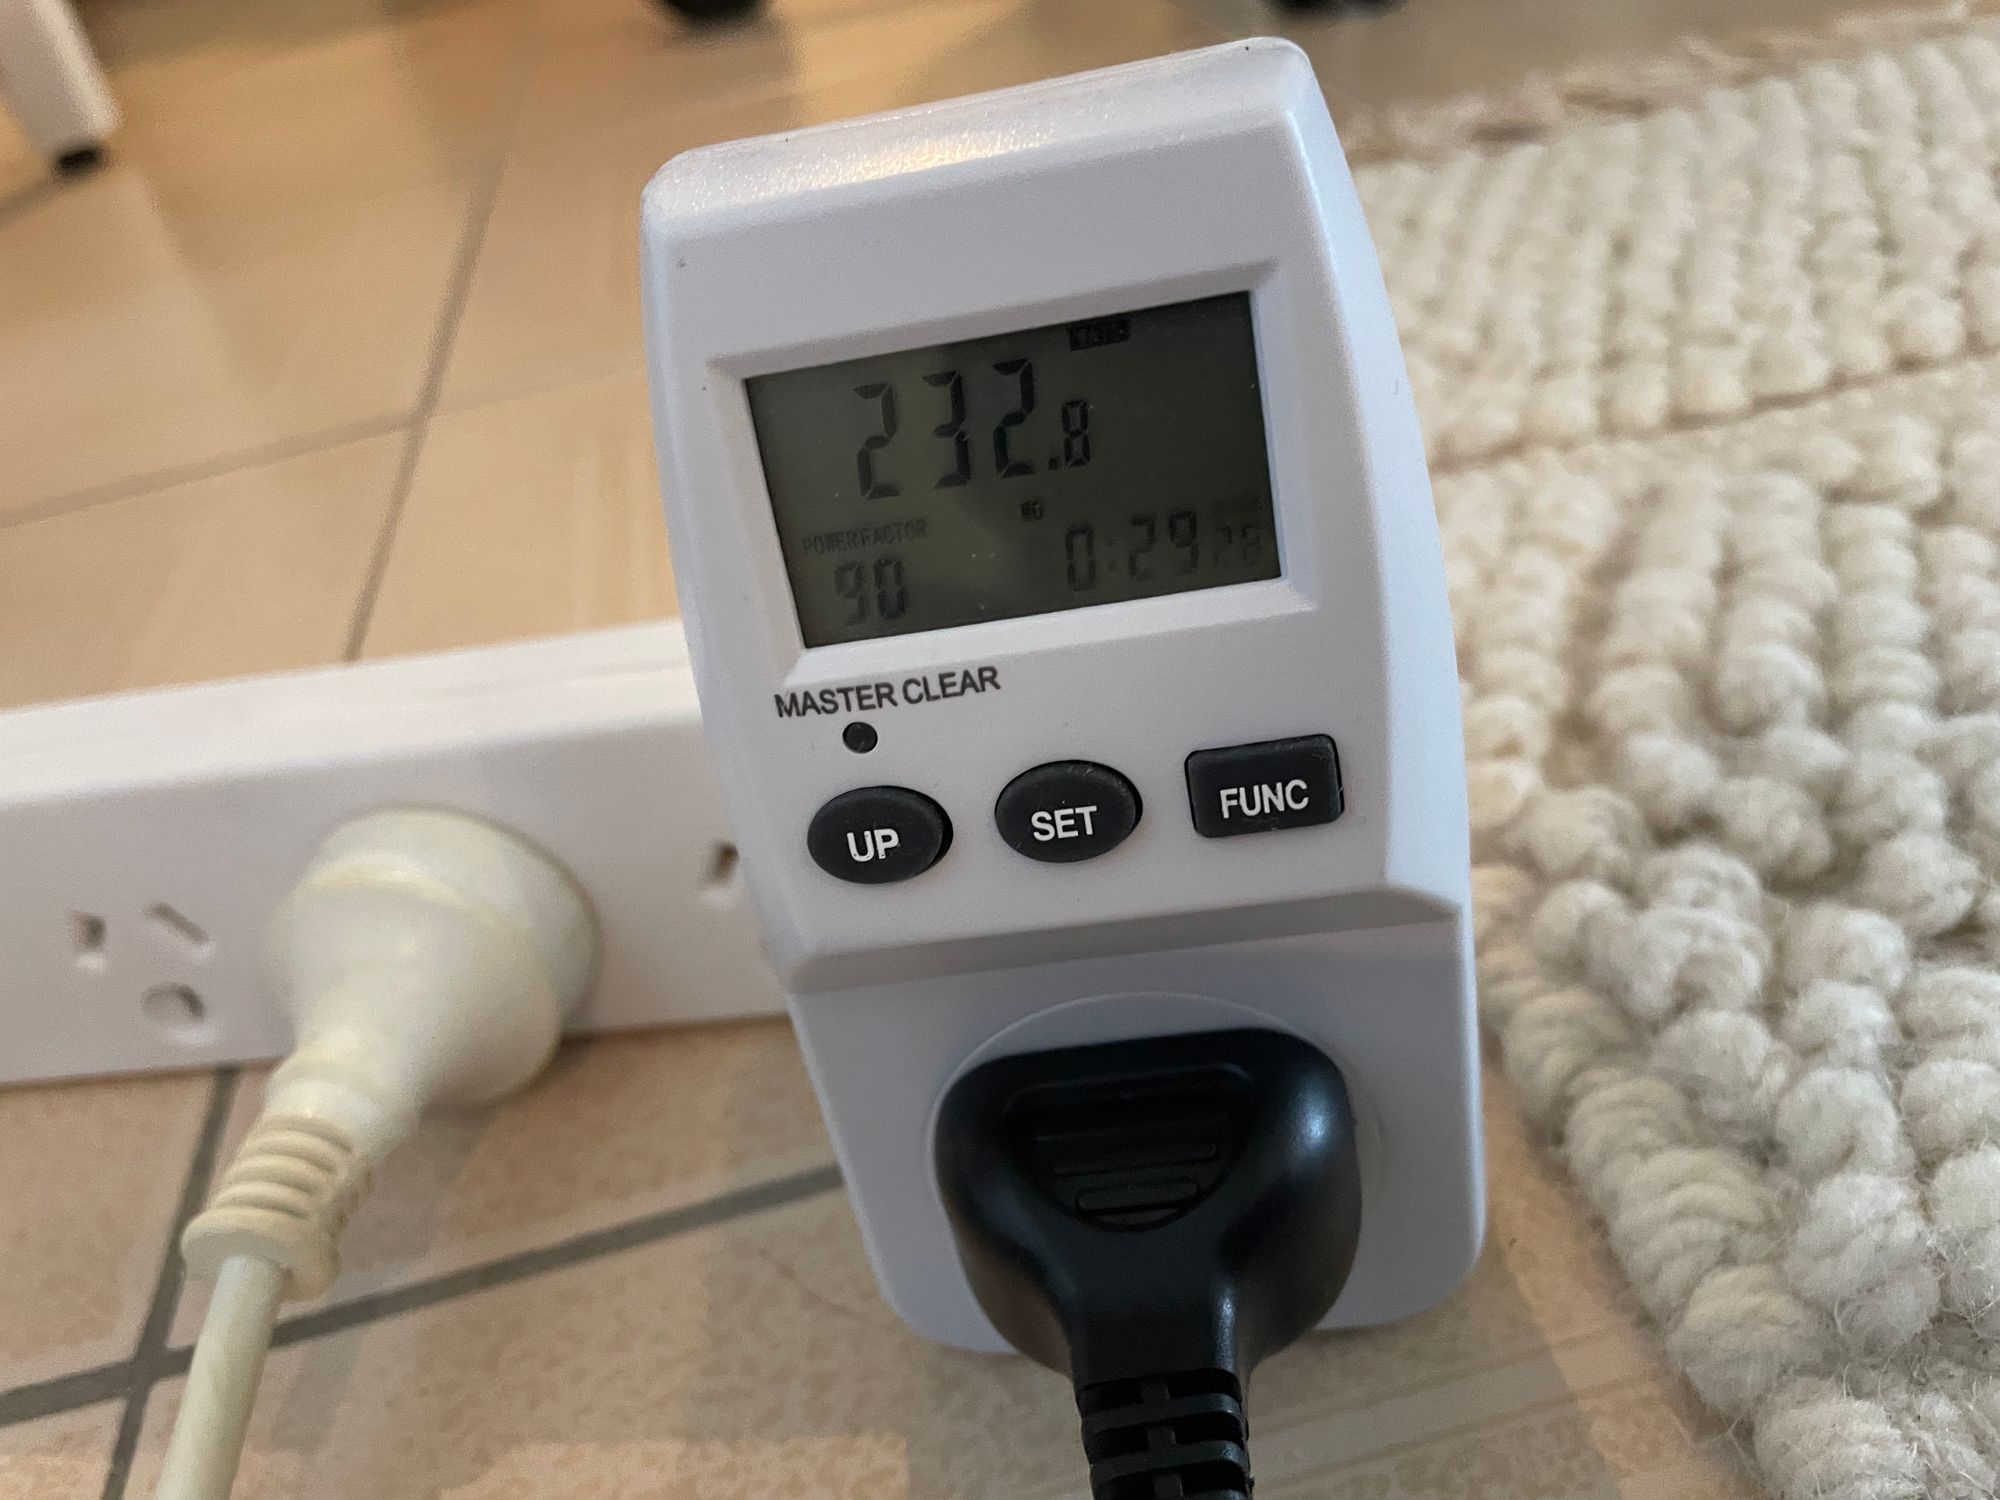
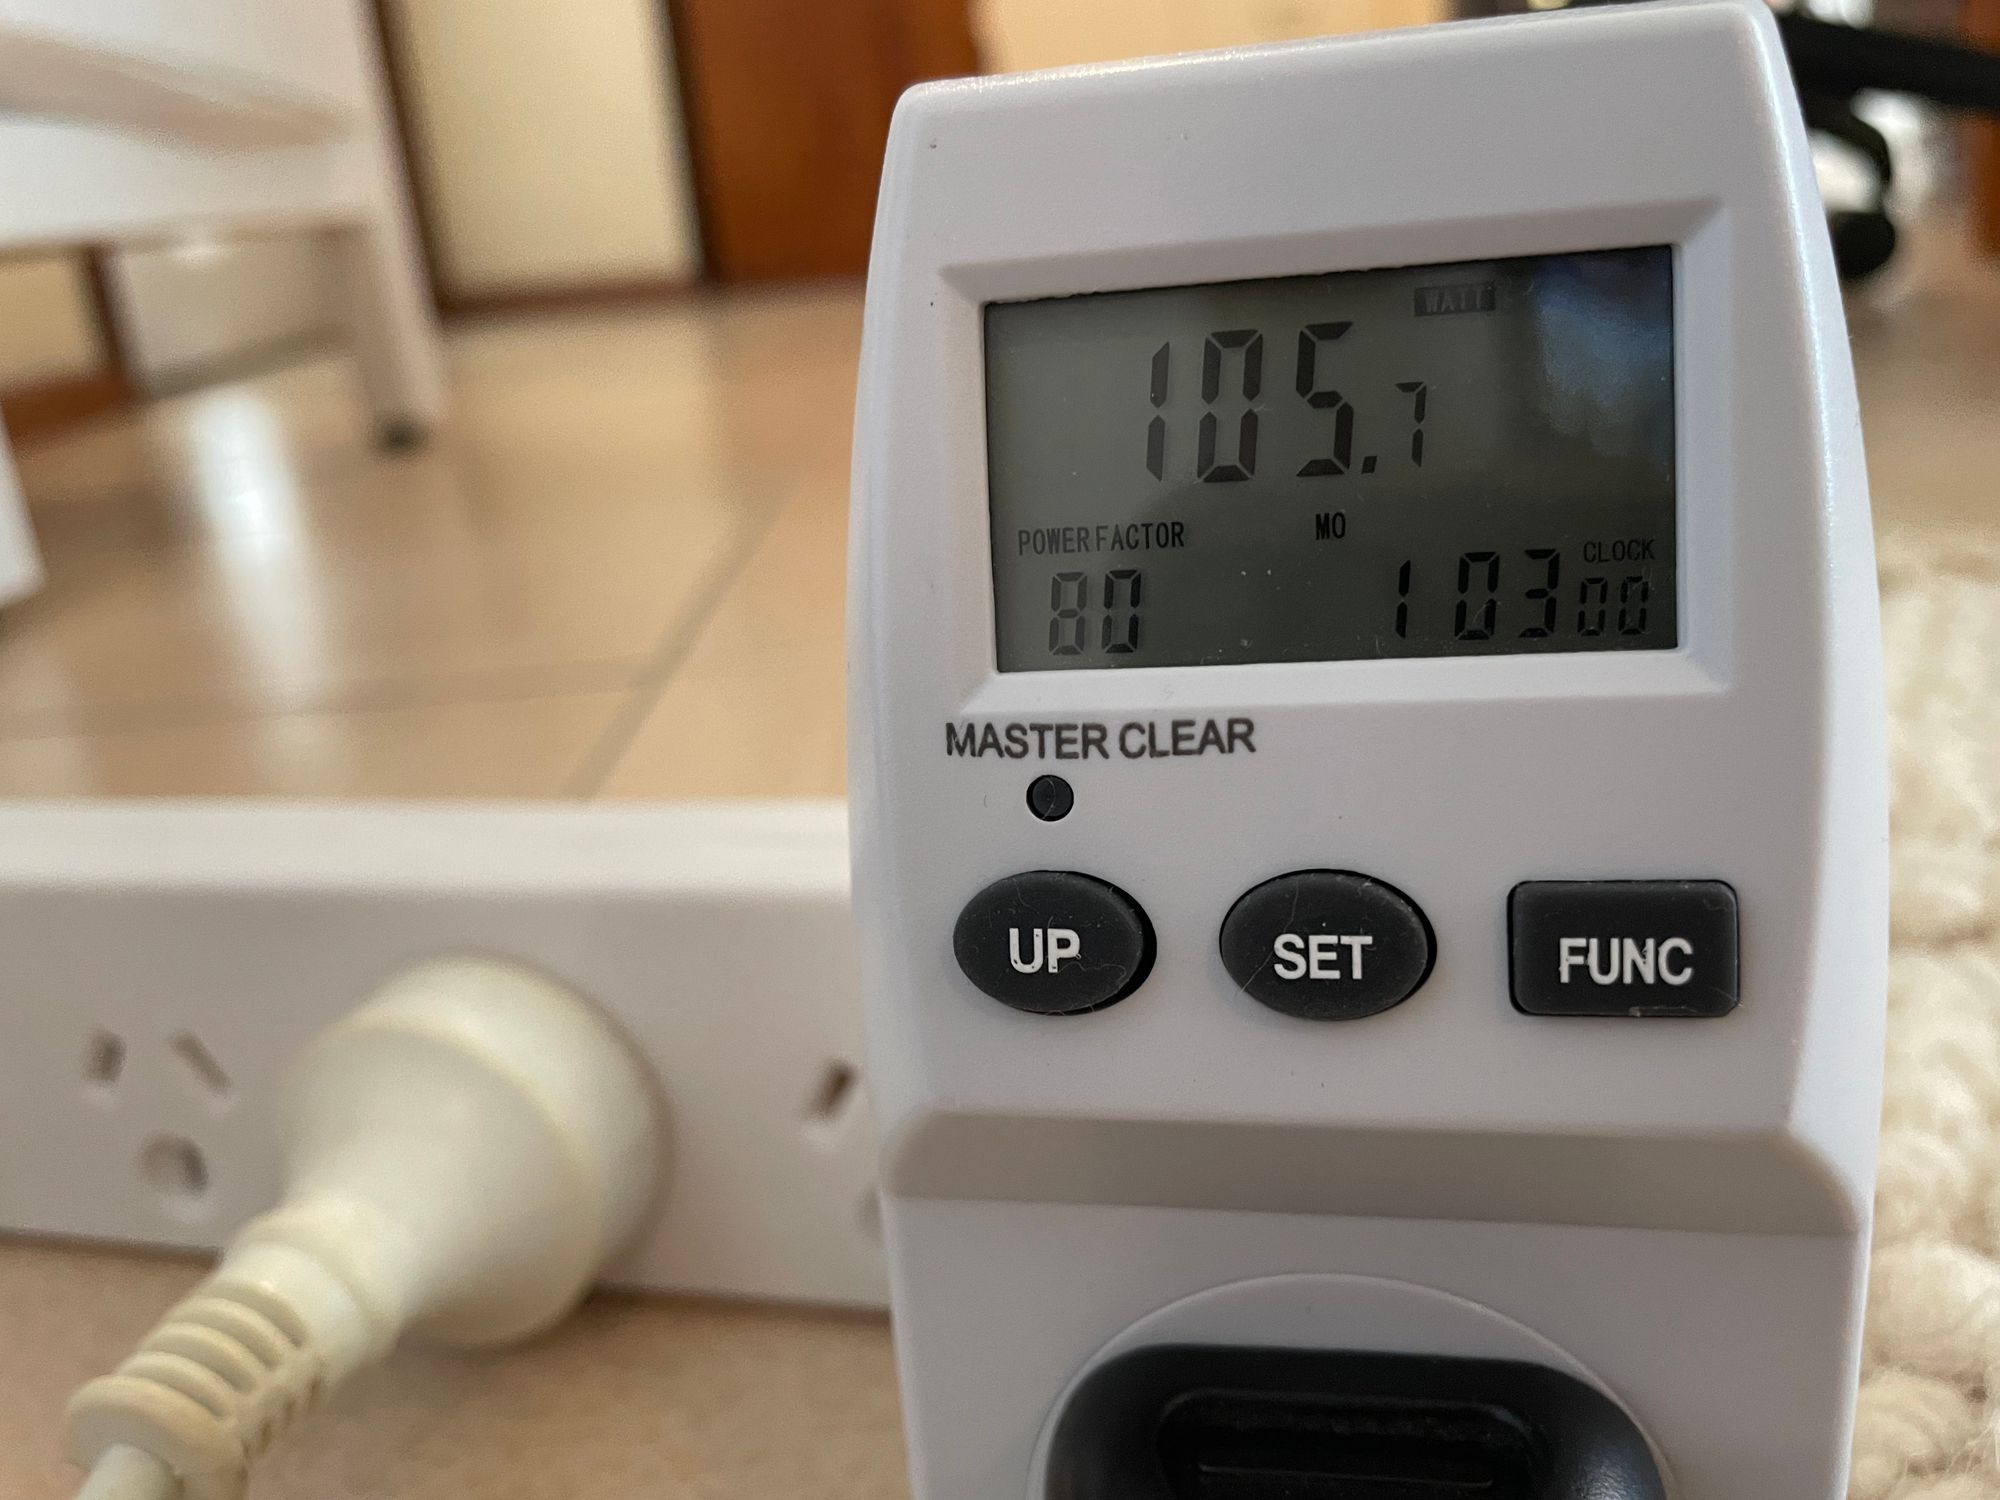
For this test, I was just interested in the power draw of the PS5 alone, so to measure that I used an inexpensive (and not especially precise) testing device I bought a few years ago as part of my original testing of power of the PS5 while writing DGACC. I read power numbers off the display (measured in watts) at various points, took screenshots and tried to add a note for context, keeping an eye on it (as much as possible!) while playing.
One final methodological note is that my PS5 has not been dust-removed since purchase, so it is a little bit dusty but I doubt it makes a noticeable difference. The room I was playing in was actually quite cold too – winter has arrived in Australia, and I played under blankets, so performance is unlikely to be affected by temperature.
Testing The Witcher 3
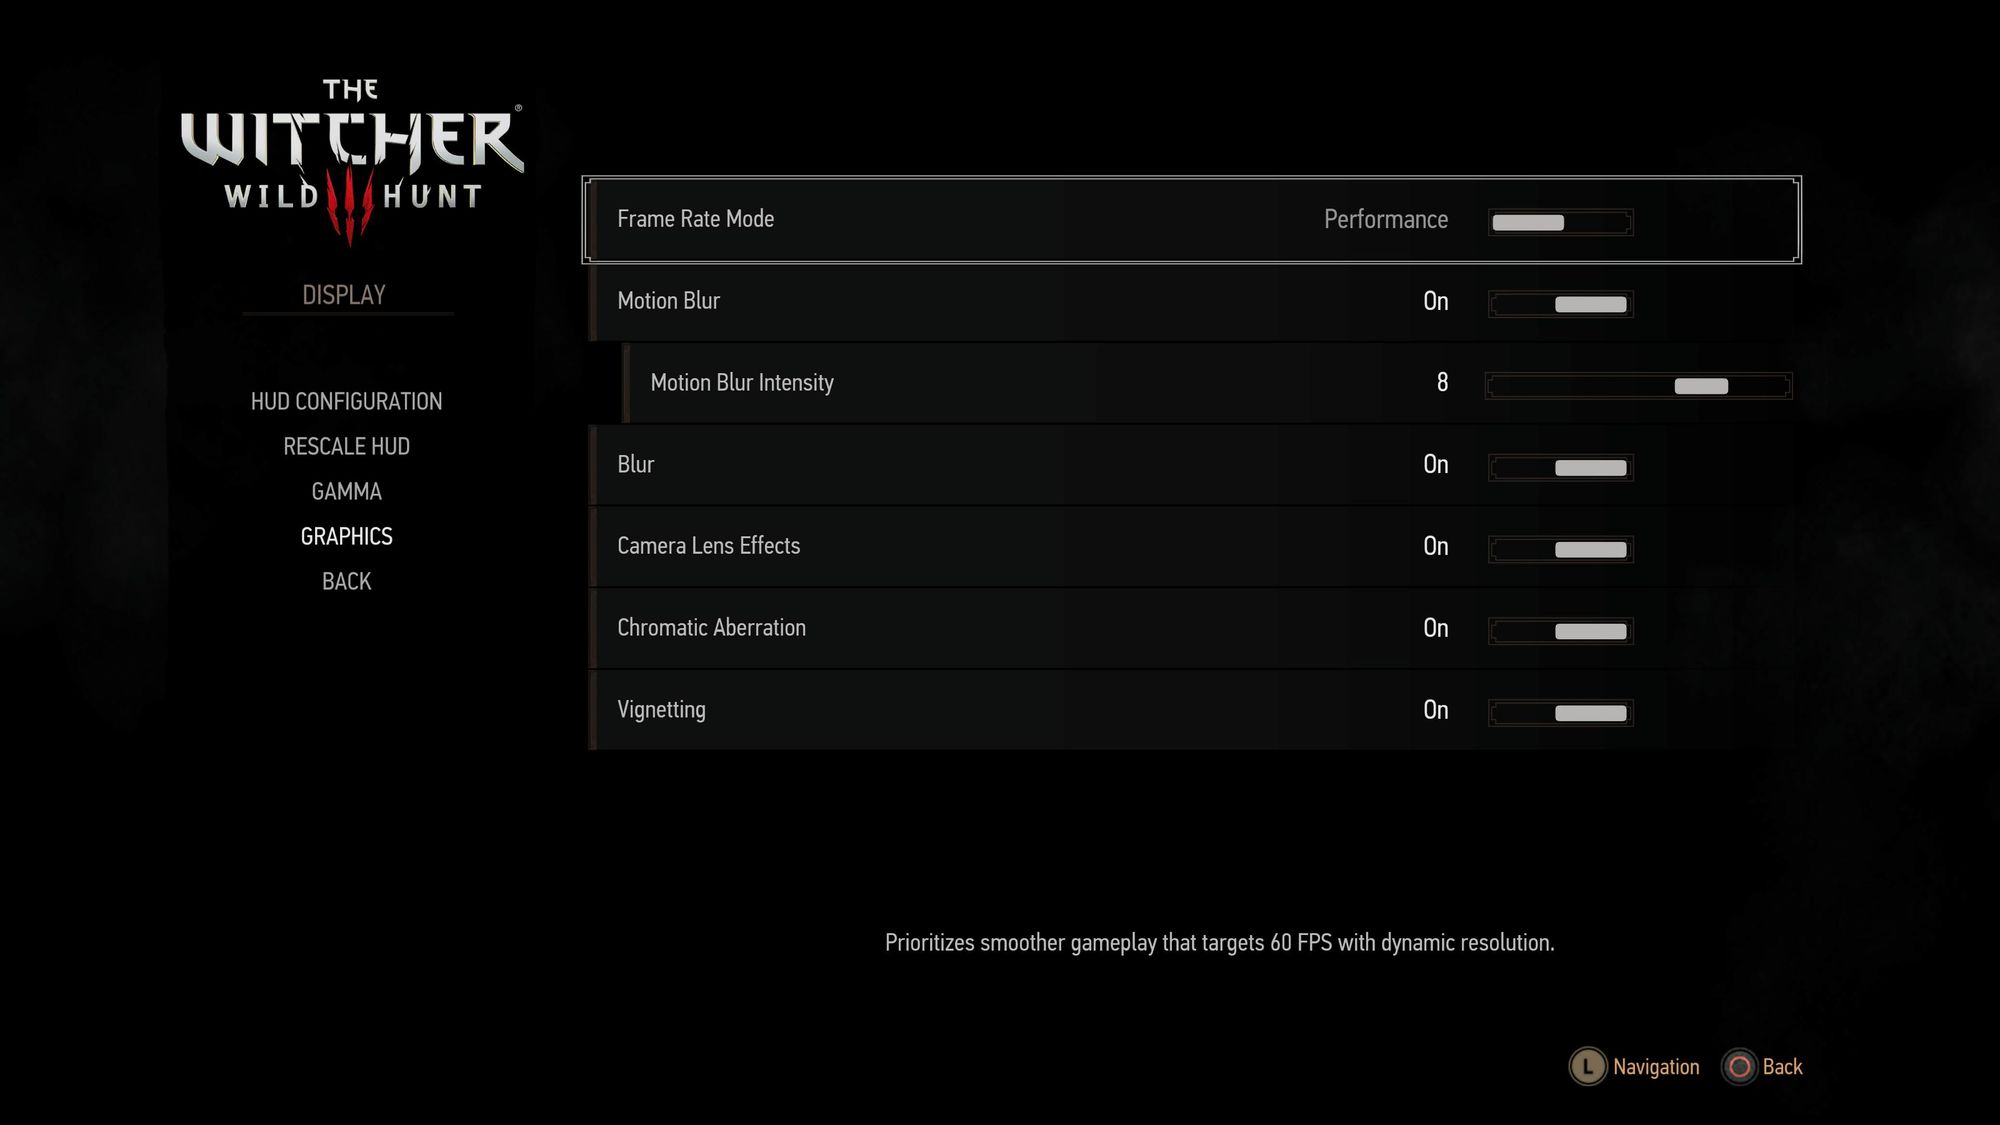
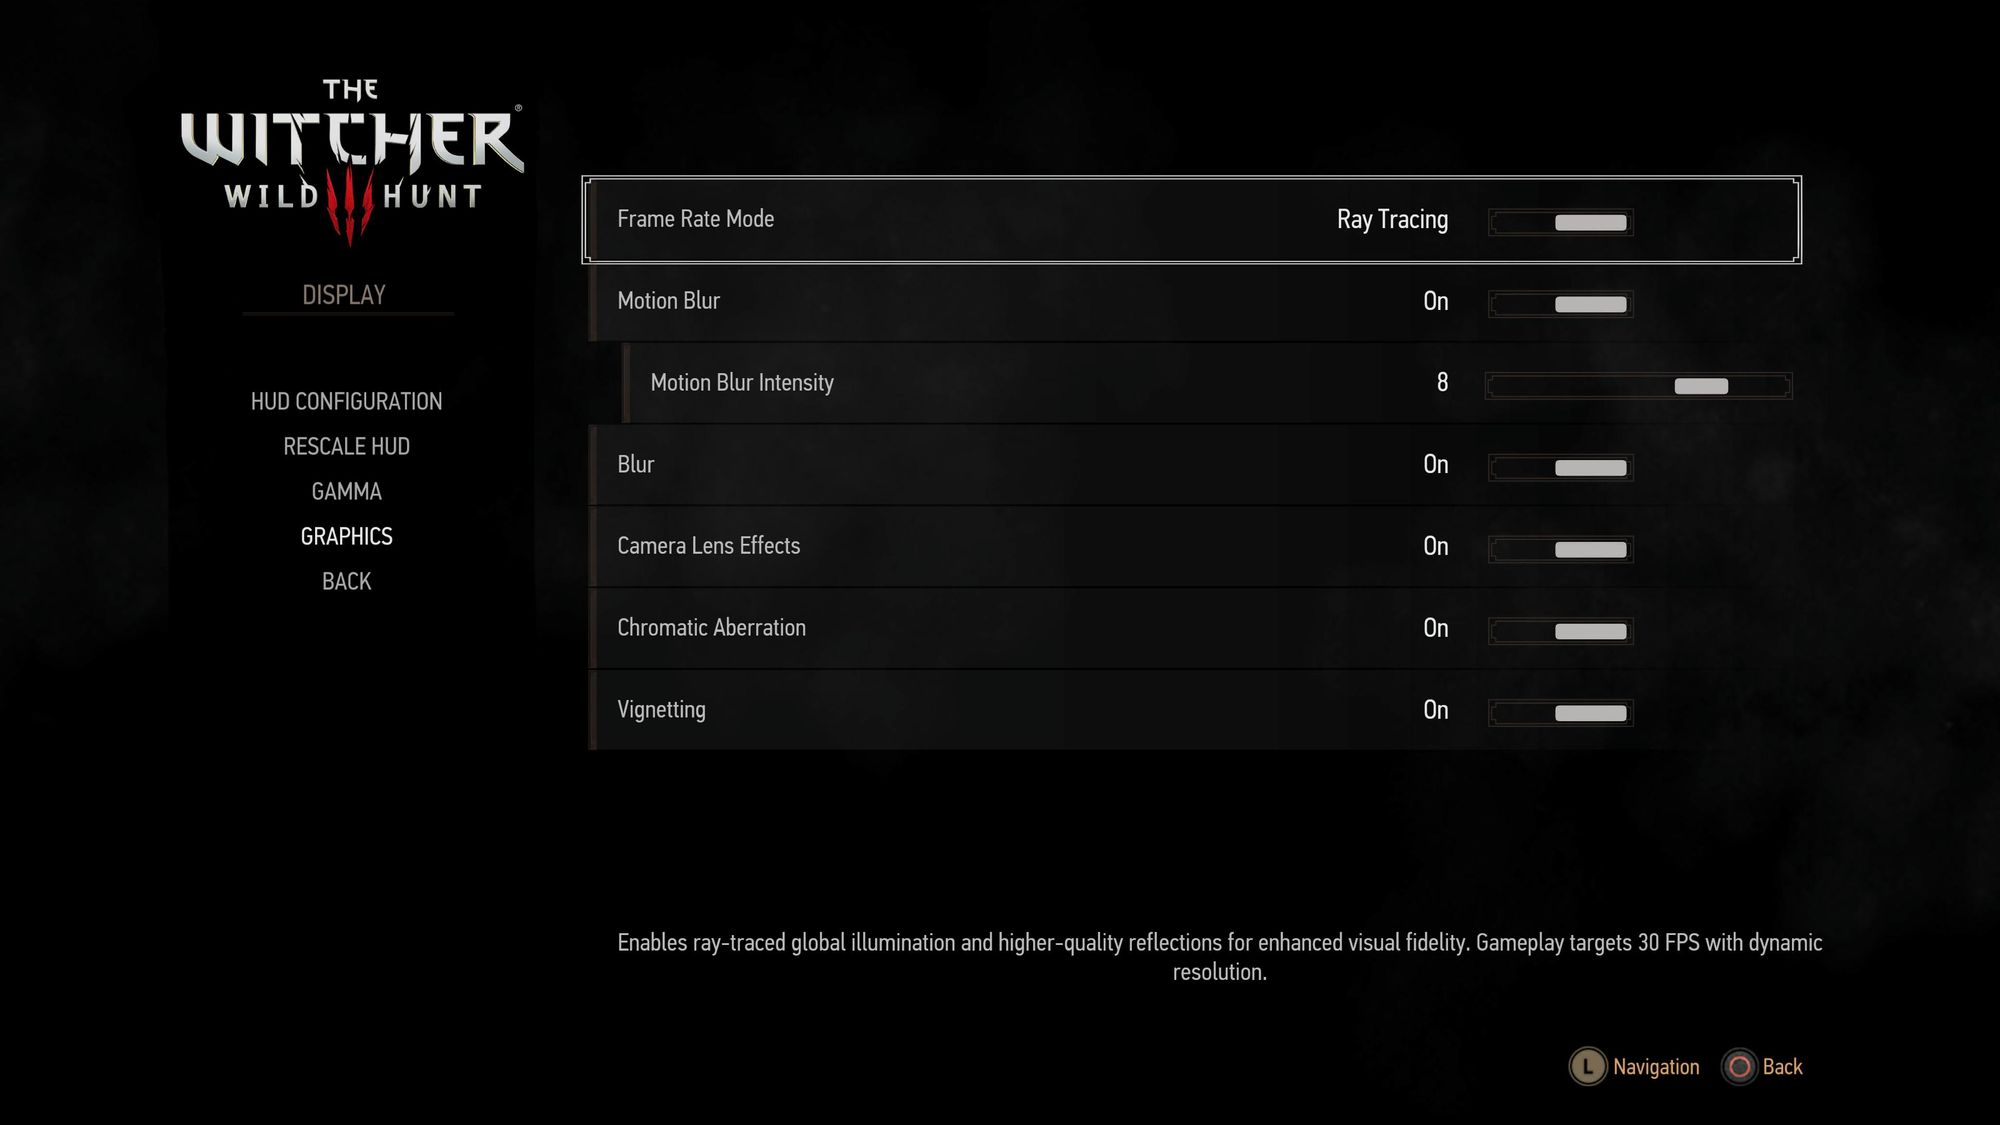
I’ve have been replaying The Witcher 3 for this past month, and wanted to see what sort of effect its “Performance” (high FPS) vs “Ray Tracing” max graphics mode had on the console’s energy consumption. These modes were added in the “next-gen update” late last year, and here’s the short explanation of both in the menu:
I also took some side-by-side screenshots of the two modes in a pair of scenes. The difference is more pronounced placed side-by-side like this, and seem mostly related to lighting. Maybe that’s what the ray tracing is for?
There’s obviously some other settings that change between the two, besides lighting and colour, but the more noticeable difference cant be seen in screenshots, as it’s to do with the FPS the game achieves.


Still images are nice, but they don’t show the qualitative different in picture smoothness that you get from seeing the game in motion. The ray tracing mode looks amazing, but it feels way too choppy to play for me, at least in 4K. (I suspect it may suit a 1080p display just fine – remember that’s 1/4 the number of pixels in an image) The downside of ray tracing mode is that it is only able to target 30FPS, and does so via (sometimes very noticeably!) dynamically reducing the render resolution. This introduces quite a noticeable amount of pixelation, as well as some strange visual effects that are hard to describe whenever there is a lot of scene activity or rapid movement. And it still feels quite sluggish at 30 FPS, especially in combat. But there’s no denying that it looks pretty when you stand still!
I started testing in “Performance” mode – which achieves a pretty consistent 60FPS even on 4K and is the mode I have spent the most time in this play through. (I can't say I have noticed any resolution drops? In fact I didn't think it did until I re-read the menu text for it) I started in the Skellige Isles and continued on the main quest line, drawing about 218 watts while I chopped up some Drowners on the north-eastern coast of Ard Skellig. Energy draw went up to about 230 watts when I got on a boat and sailed across the wide open seas for a few minutes. I suspect the long render distance and complex water effects were a bit more taxing than being on land. I joined Yennifer in the search for Ciri on Hindarsfjall and through a couple of cutscenes the power stayed at around 230 watts. The highest number I saw (I couldn’t watch the screen as well as the power meter) during the 30mins of playing in Performance mode was 234 watts. That’s seems like it’s about as high as it gets on the PS5 (this model at least).
At the end of the 30mins the power meter displayed a cumulative power use of 0.1kWh, though only getting this figure to one decimal place is not really precise enough to be able to conclude anything. 230 watts over an hour would produce 0.23 kWh so the same energy over 30 mins is probably somewhere between 0.1 and 0.2 kWh, which fits.
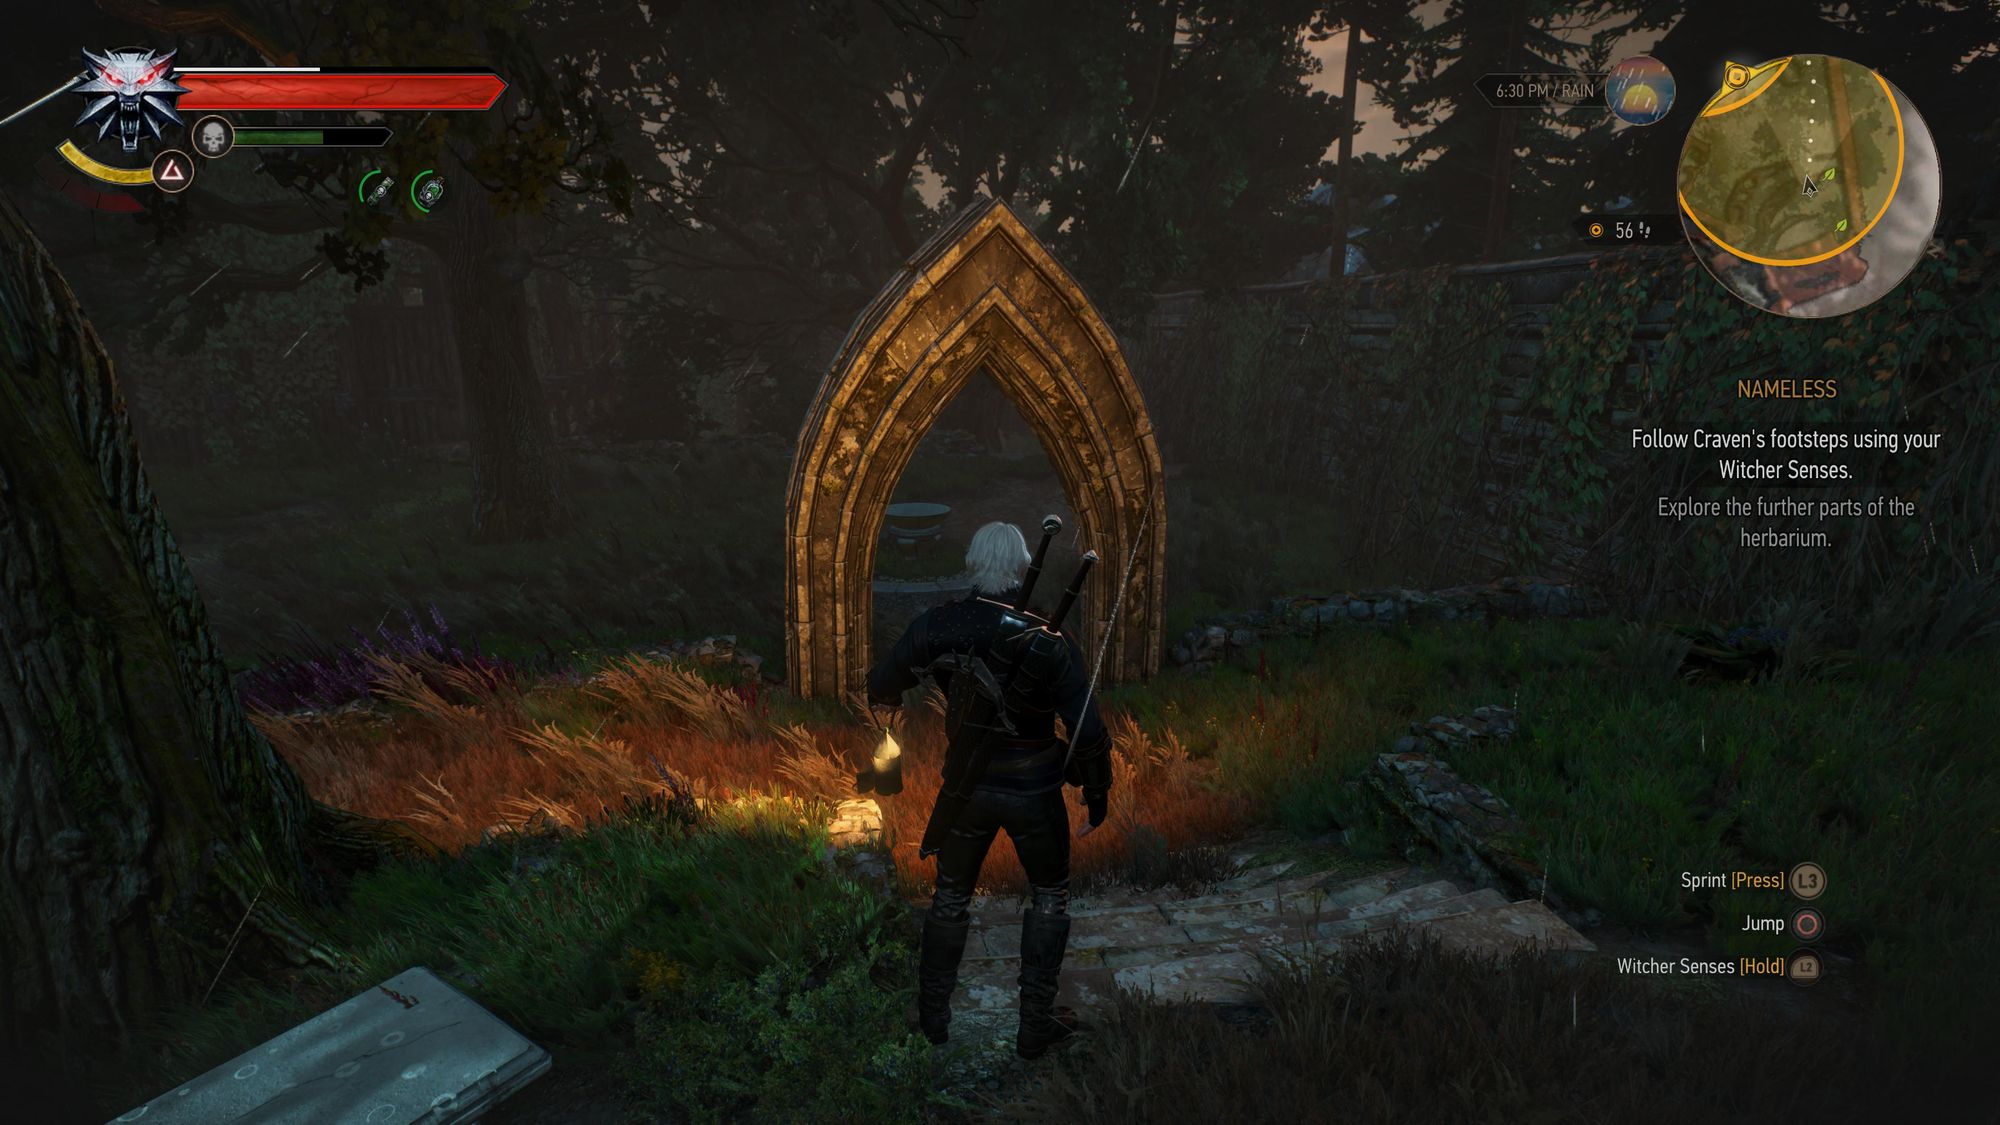
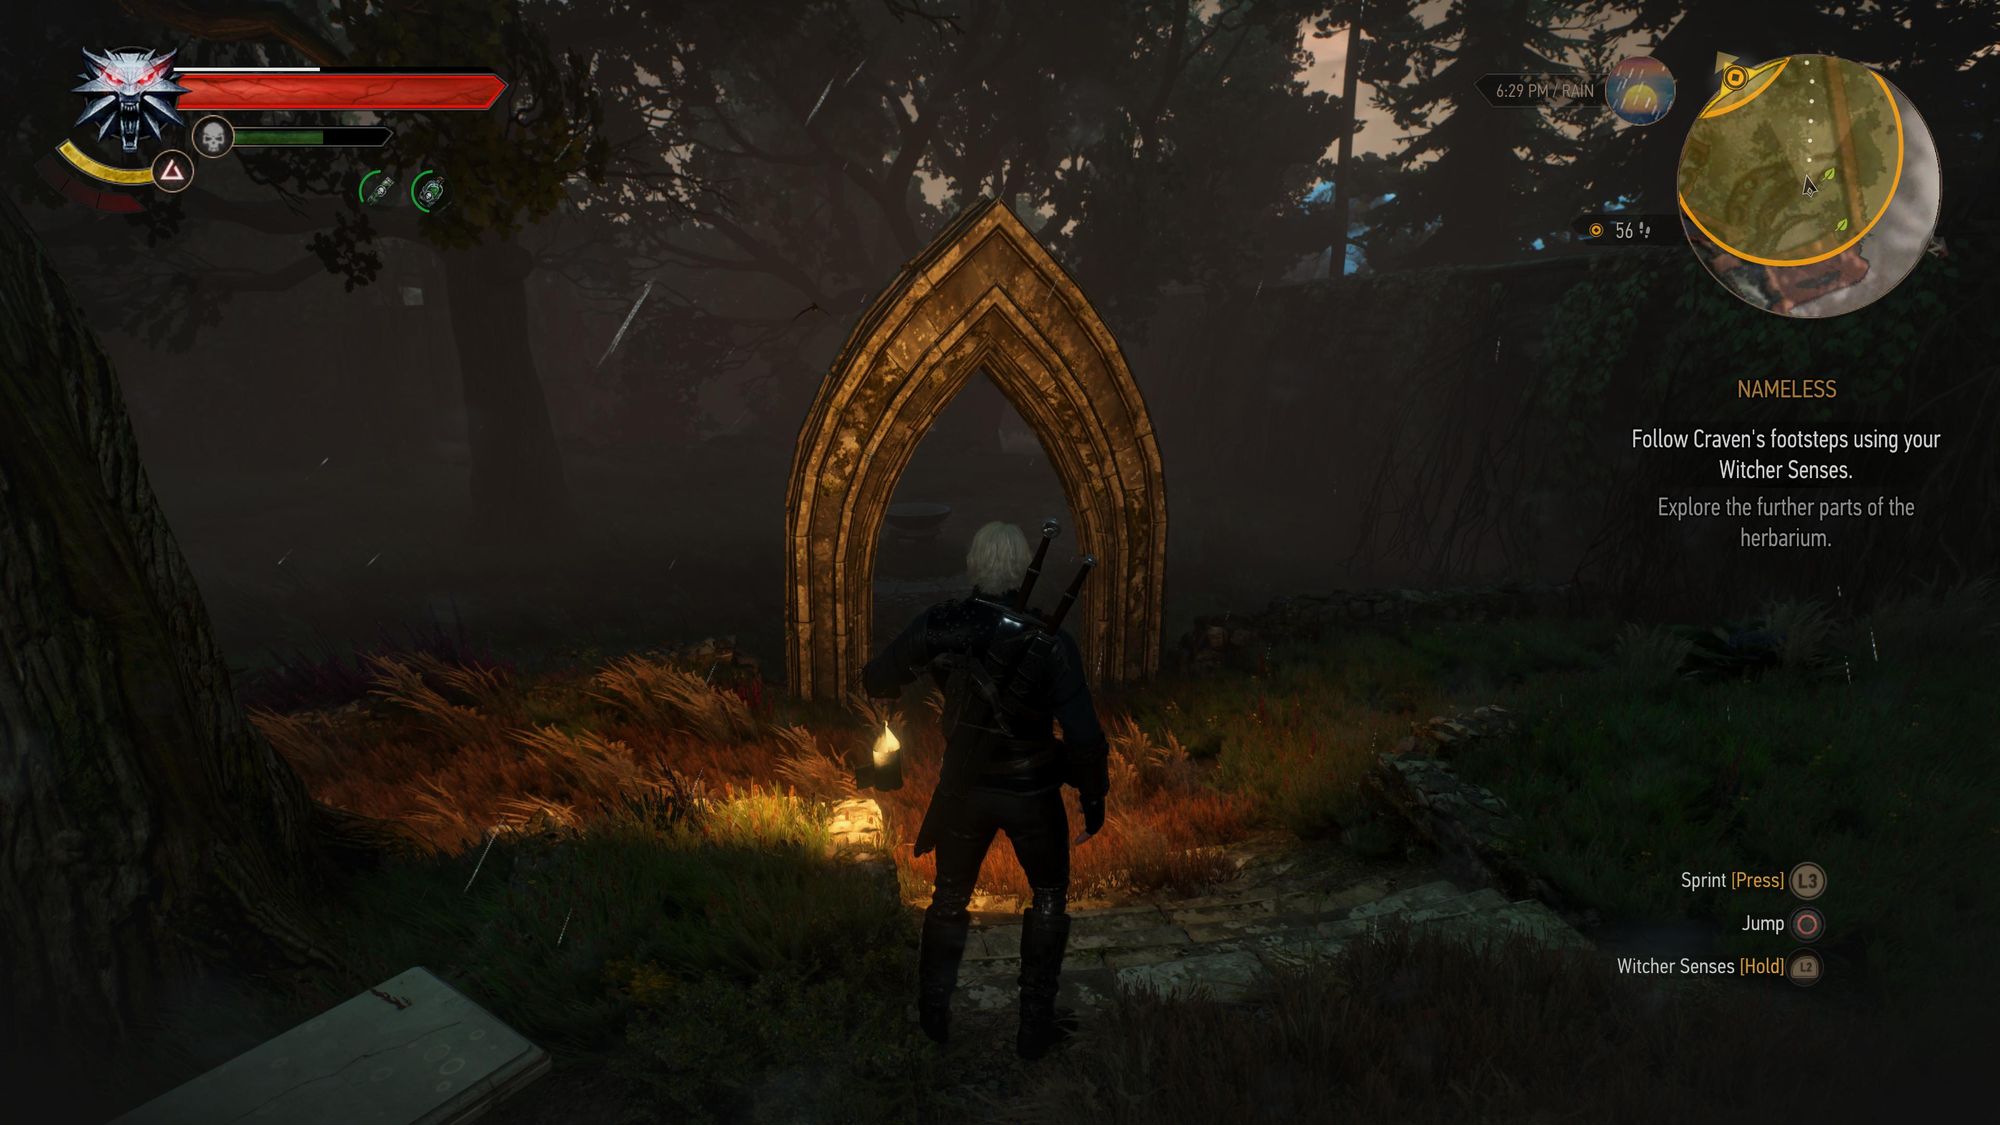
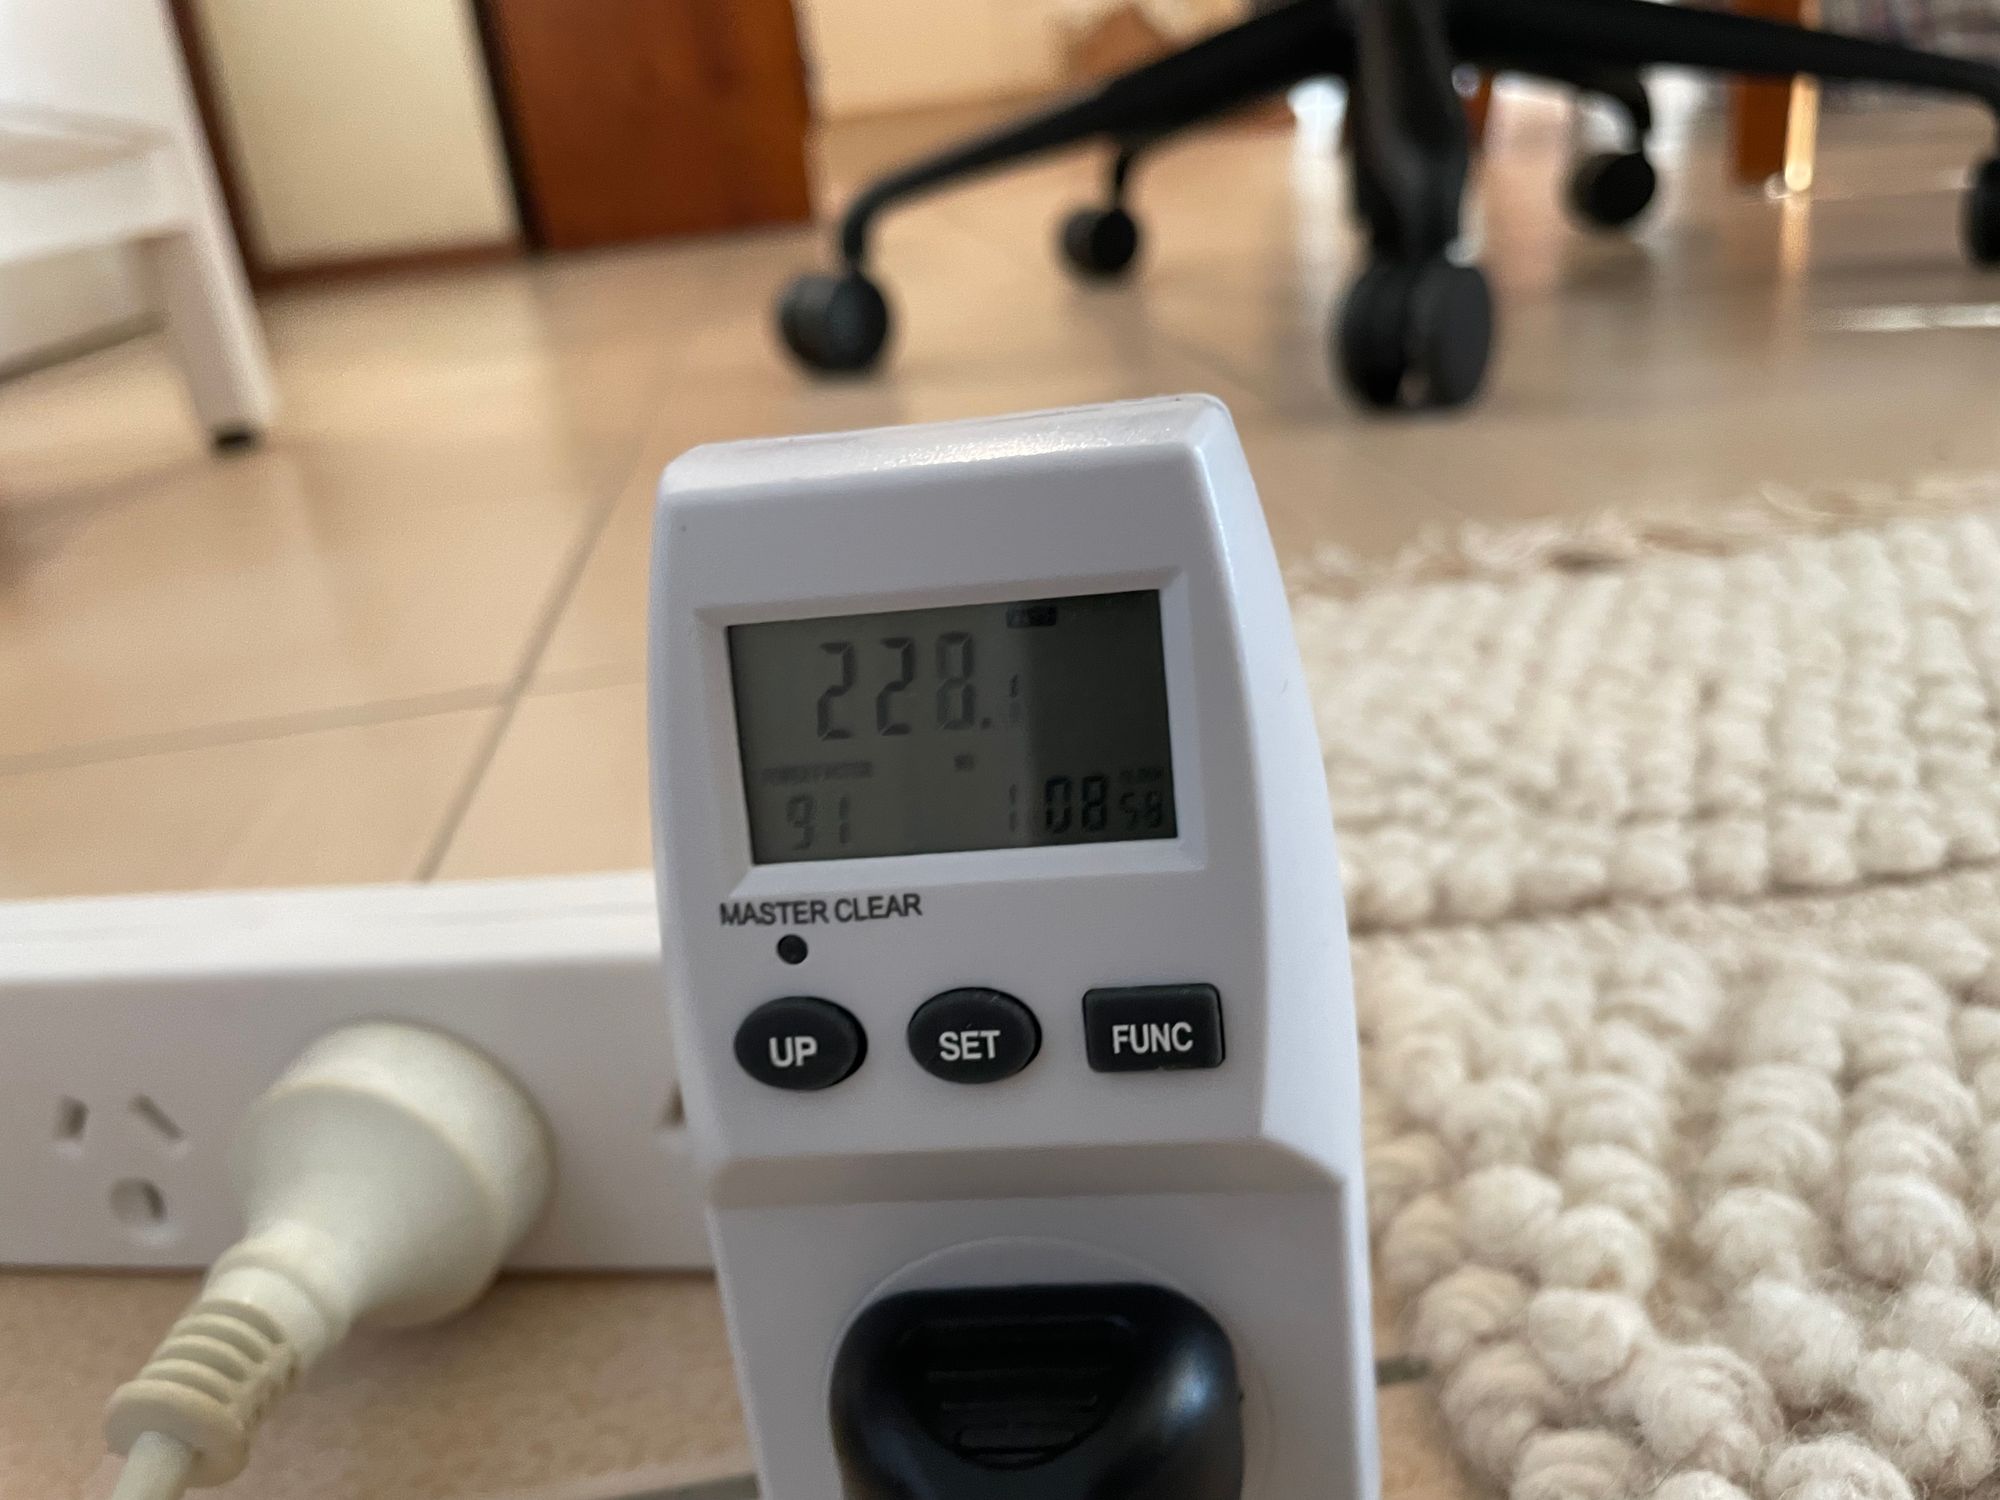
I then switched over to “ray tracing” mode, and wandered over to Freya's Garden in search of a coward named Craven, who went off to fight a monster called Morkvarg (a werewolf cursed with undying and eternal hunger). I followed their trail around the garden for about 30mins, enduring the comparatively sluggish 30 FPS and resolution dips while appreciating the distinctly moody lighting. This 30 mins was all spent on land, and the garden is an enclosed space so that might have affected the numbers a bit, however its not an entirely enclosed level, and the rest of the world outside the garden is still there and occasionally visible over the walls, so I suspect its still pretty comparable. I did notice a small dip in the numbers (and the resolution seemed slightly more consistent) when I went inside a building and did battle with Morkvarg, but it was fairly small.
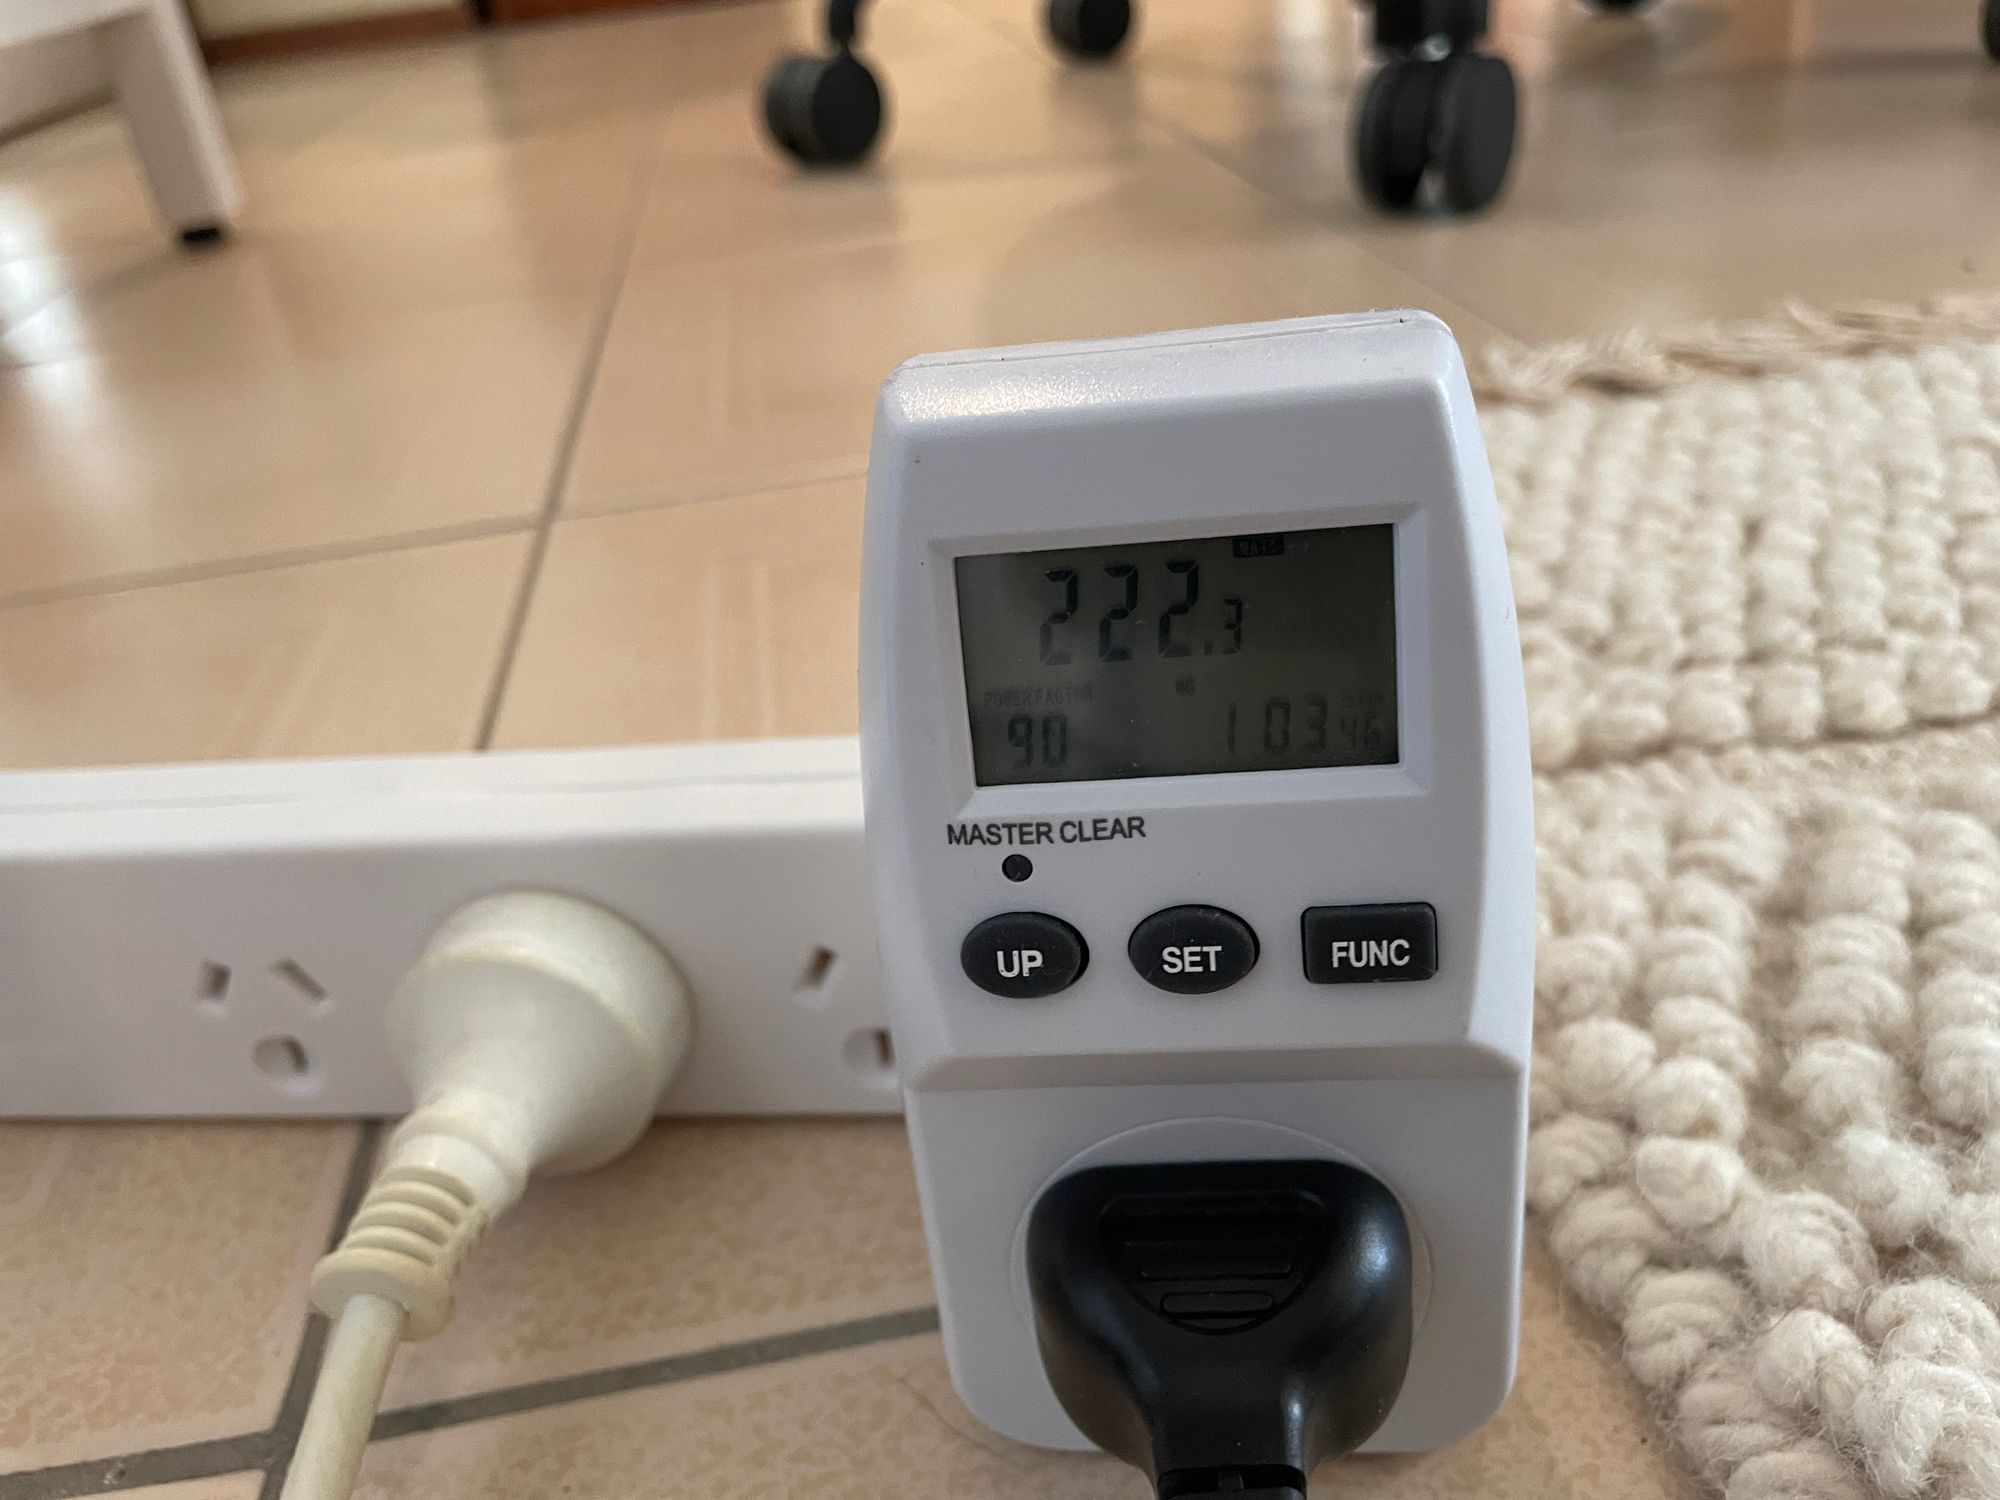
If anything the typical power numbers I saw in the Ray tracing mode were perhaps a tiny bit lower than performance mode. Closer to 220 than 230. How might we explain this? If it's not just my imprecise measuring (which it could be!) then I suspect it’s something to do with the more aggressive use of dynamically reducing the resolution in this mode. If you read my write-up of the Xbox end-user energy tools, you’ll remember that the main things that both the Unreal and 343i engineers found affected energy draw were resolution and frame rates. While both modes say they involve dynamic resolutions, it's possible that the 30 FPS mode spends longer, or more time at lower resolutions?
At the end of the 30mins of playing in ray tracing mode the power meter displayed a cumulative power draw of 0.2 kWh – having added just another 0.1 kWh like the first 30mins. Again, this sort of test is a bit too short, and the power levels too small (not to mention the power meter a bit too imprecise) to really be able to register a substantial difference between the modes. This is a somewhat surprising finding though, because I genuinely expected the performance 60 FPS mode to use a bit less (in line with some other research I've seen) by having more headroom in terms of graphics processing power, enabling it to hit the 60 FPS target consistently. Perhaps that's eaten up by pushing it closer to the edge of performance, and with occasional dynamic resolution scaling down the odd "slow" frame (It's also possibly less noticeable when one or two frames out of 60 of them drop in resolution vs when you're only getting 30 a second). However if anything though the evidence seems to tentatively suggest the opposite. At least, it's a negligible difference.
Menu and pause screens
I also tested the pause and inventory screens – as I wanted to see what that might show. In The Witcher 3, there is a ‘pause’ screen which freezes in-game action and overlays a menu with save/load and other options, keeping the 3D world visible behind it. Time also stops when on the ‘inventory’ screen, but it appears as a separate scene, no longer rendering the 3D game world. I found that hitting the ‘pause’ screen didn’t really change the power draw much, but visiting the inventory/quest/map screens did. Interesting!
There was even a 3D model of Geralt in the inventory screen, and it still showed less power. The most likely explanation is that rendering the huge, expansive open world is the most taxing part of The Witcher 3, and while it remains on screen the game is still ‘rendering’ it every frame, even if it is completely ‘paused’.
So there is at least one clear takeaway: don’t pause on the pause menu when you walk away from The Witcher 3 – open your inventory instead.
Testing Destiny 2’s 120Hz crucible mode
The other game I tested was Destiny 2, looking at the effect (again, if any) of the 120 Hz crucible mode vs the default 60 FPS. I took some numbers along the way in various parts of the game as well just for comparisons sake, all in normal 60FPS mode, HDR enabled. Readings were taken at the login screen (172 watts), in space (162 watts), after loading into the main social space the tower (216 watts), on the inventory screen (182 watts), in space again though this time while searching for a crucible match (182 watts – 20 higher than the last time I was in space, but I was also in front of a different ‘planet’ so that might be the answer, rather than some huge extra networking power), and loading into a crucible match (212-220 watts).
Here’s some side-by-side comparisons of the two modes and their effect on the image, taken from a private match on the (very beautiful) map Disjunction:
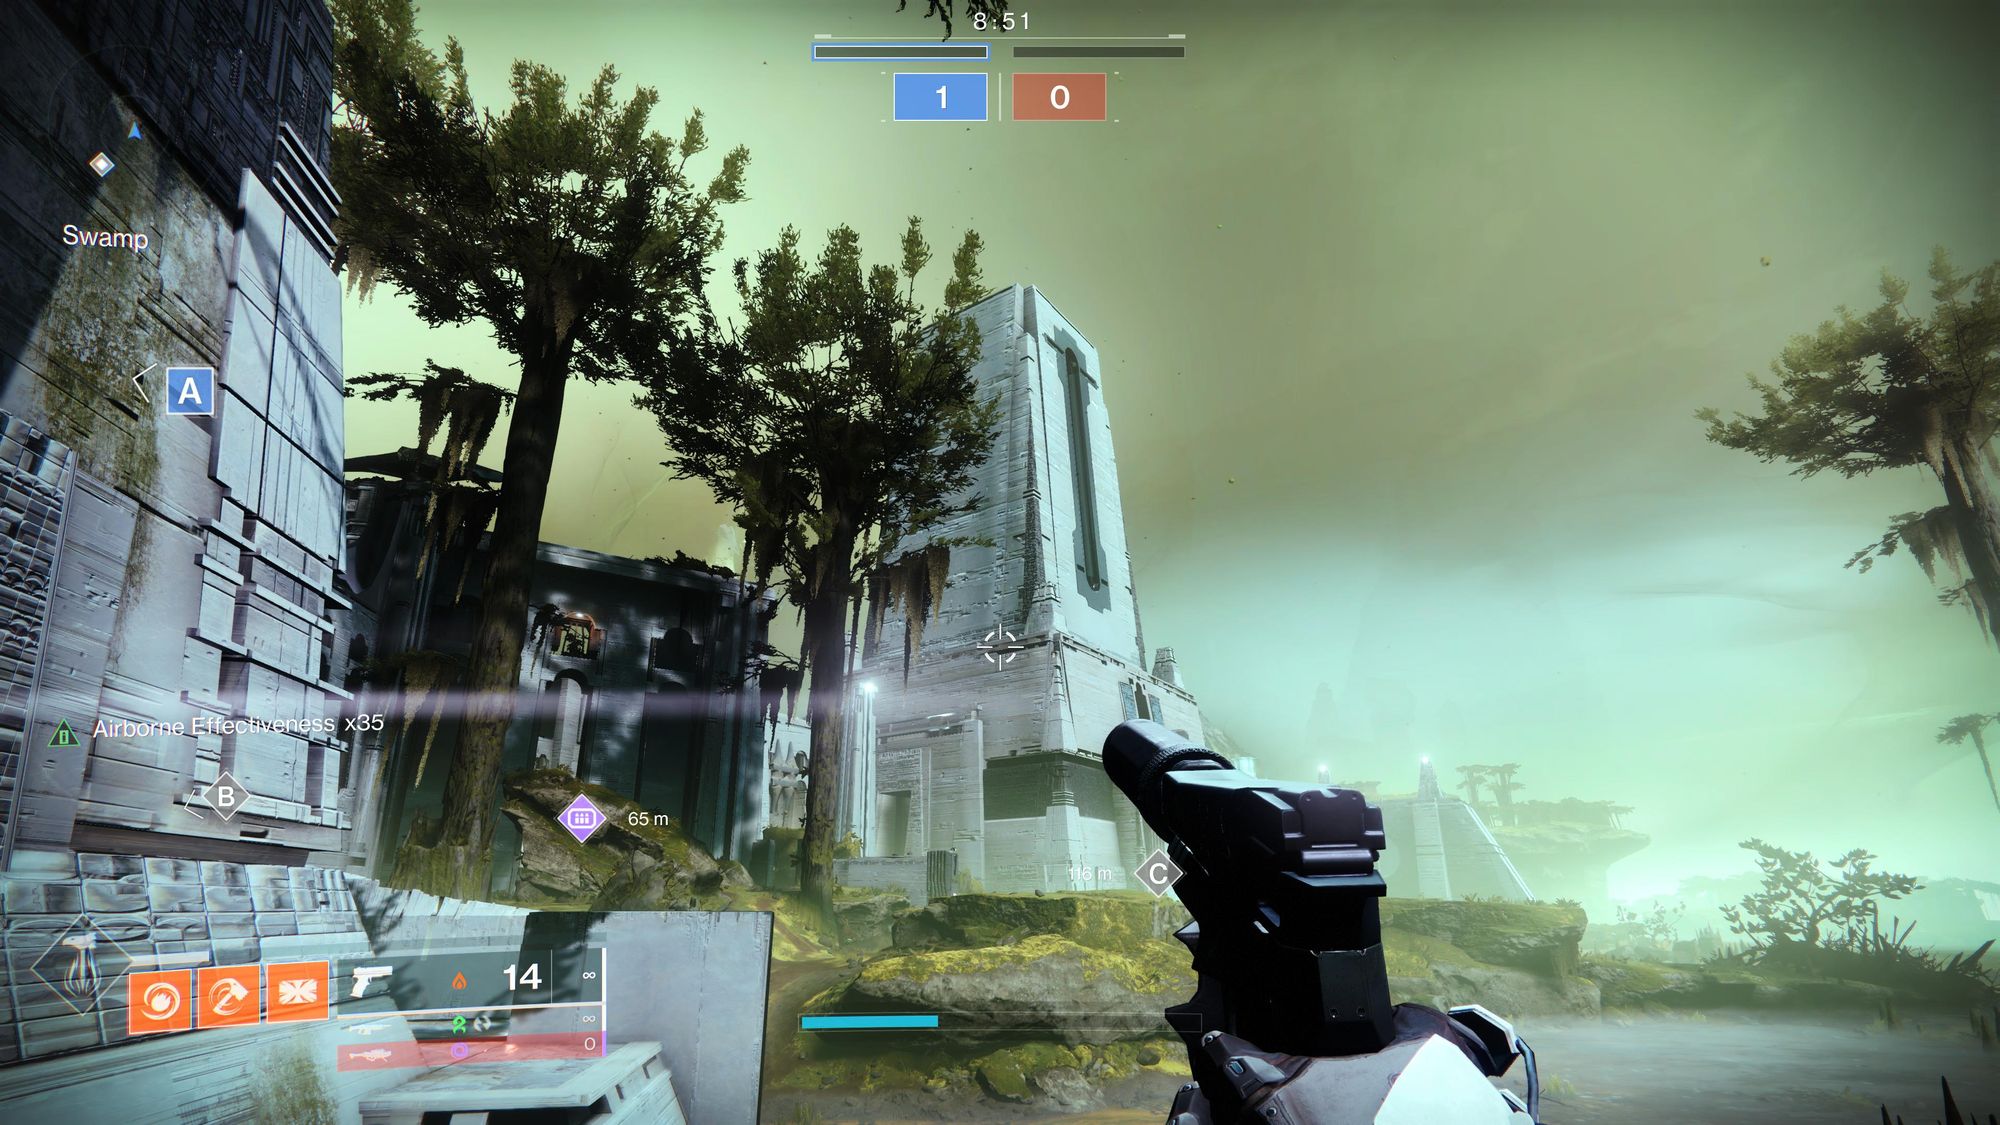
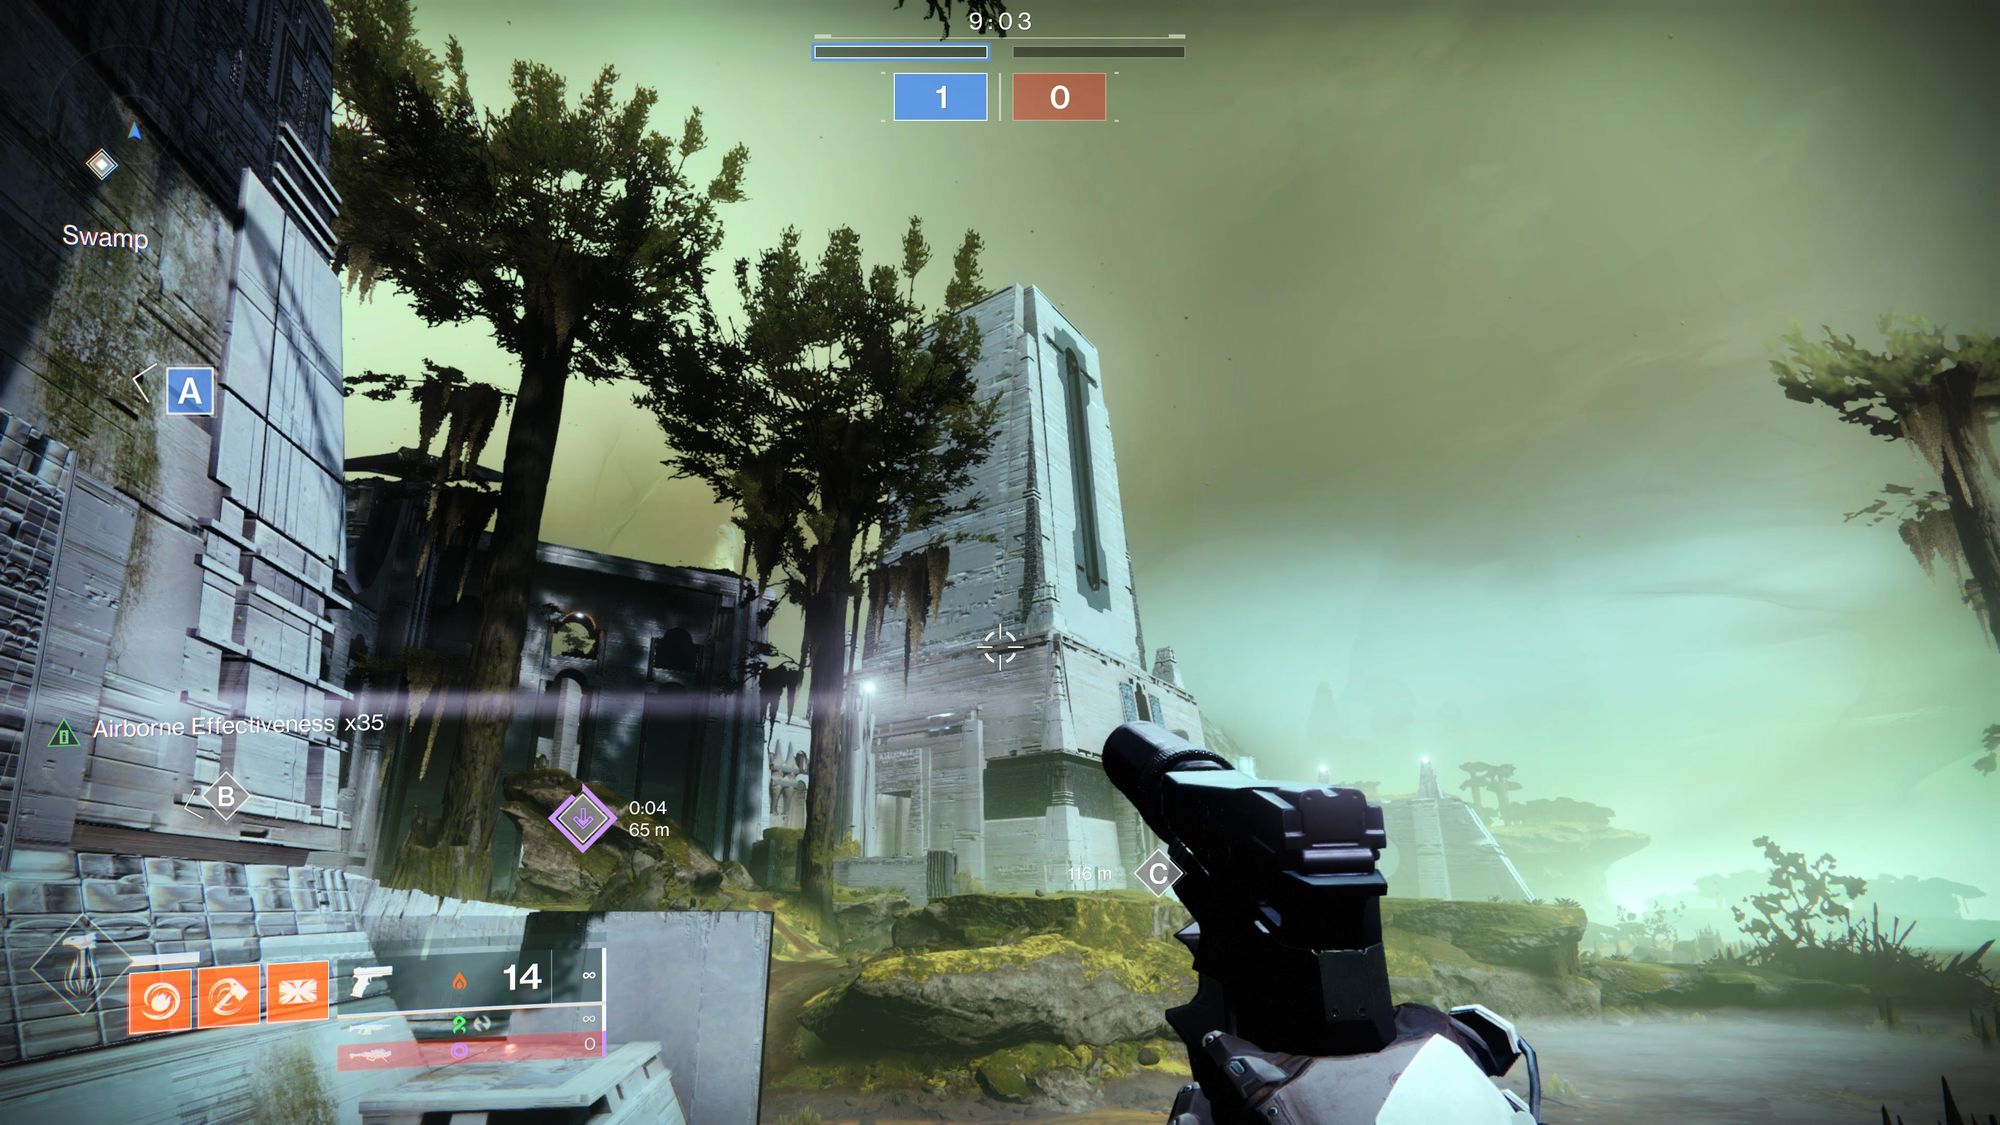
I have to admit, seeing them side-by-side like this is really illuminating (especially if you tab back and forth between them), but I would never have noticed the background tree texture resolution drop otherwise. My focus in a competitive mode like the crucible, is 100% on enemy players and friendly teammates. No one’s looking at the trees! Makes sense to cut some corners.
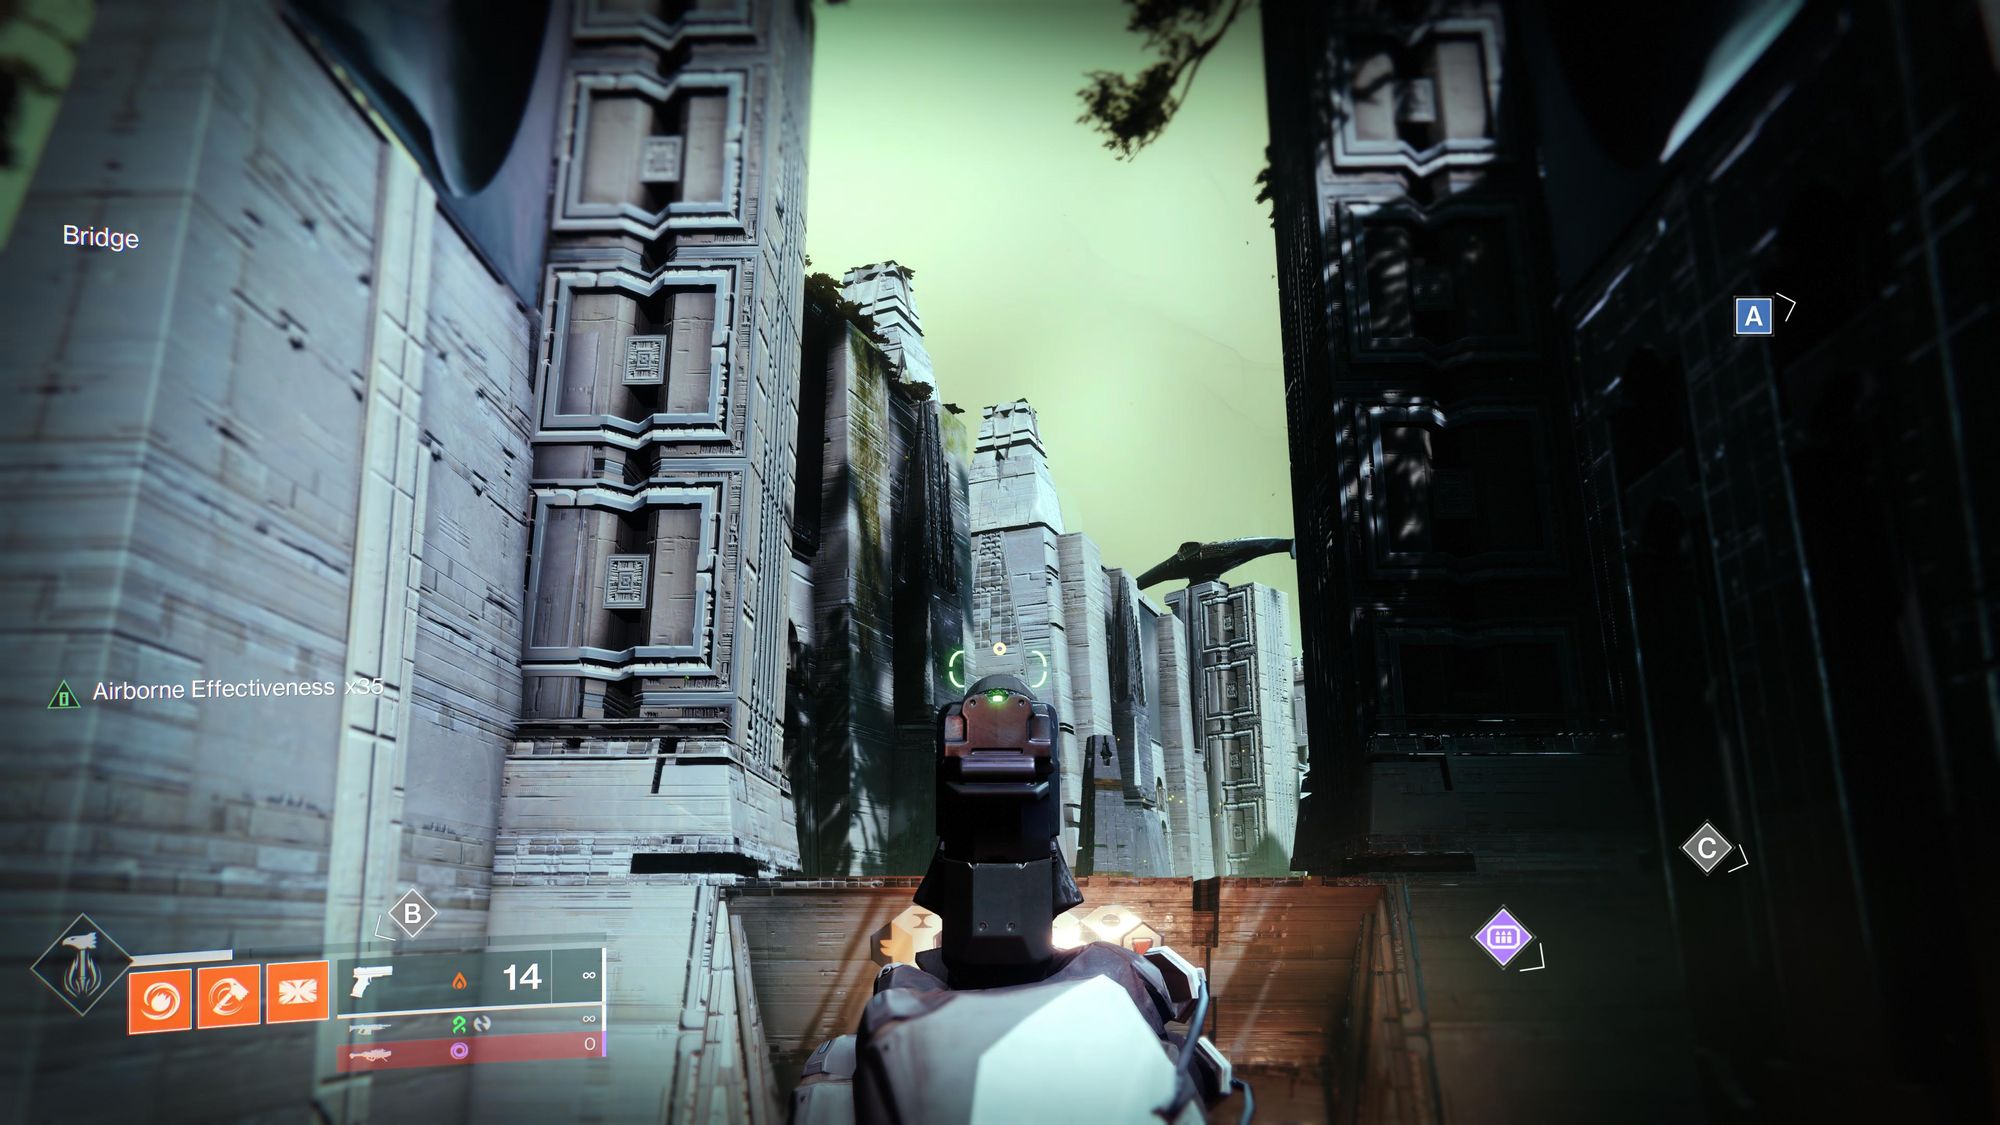
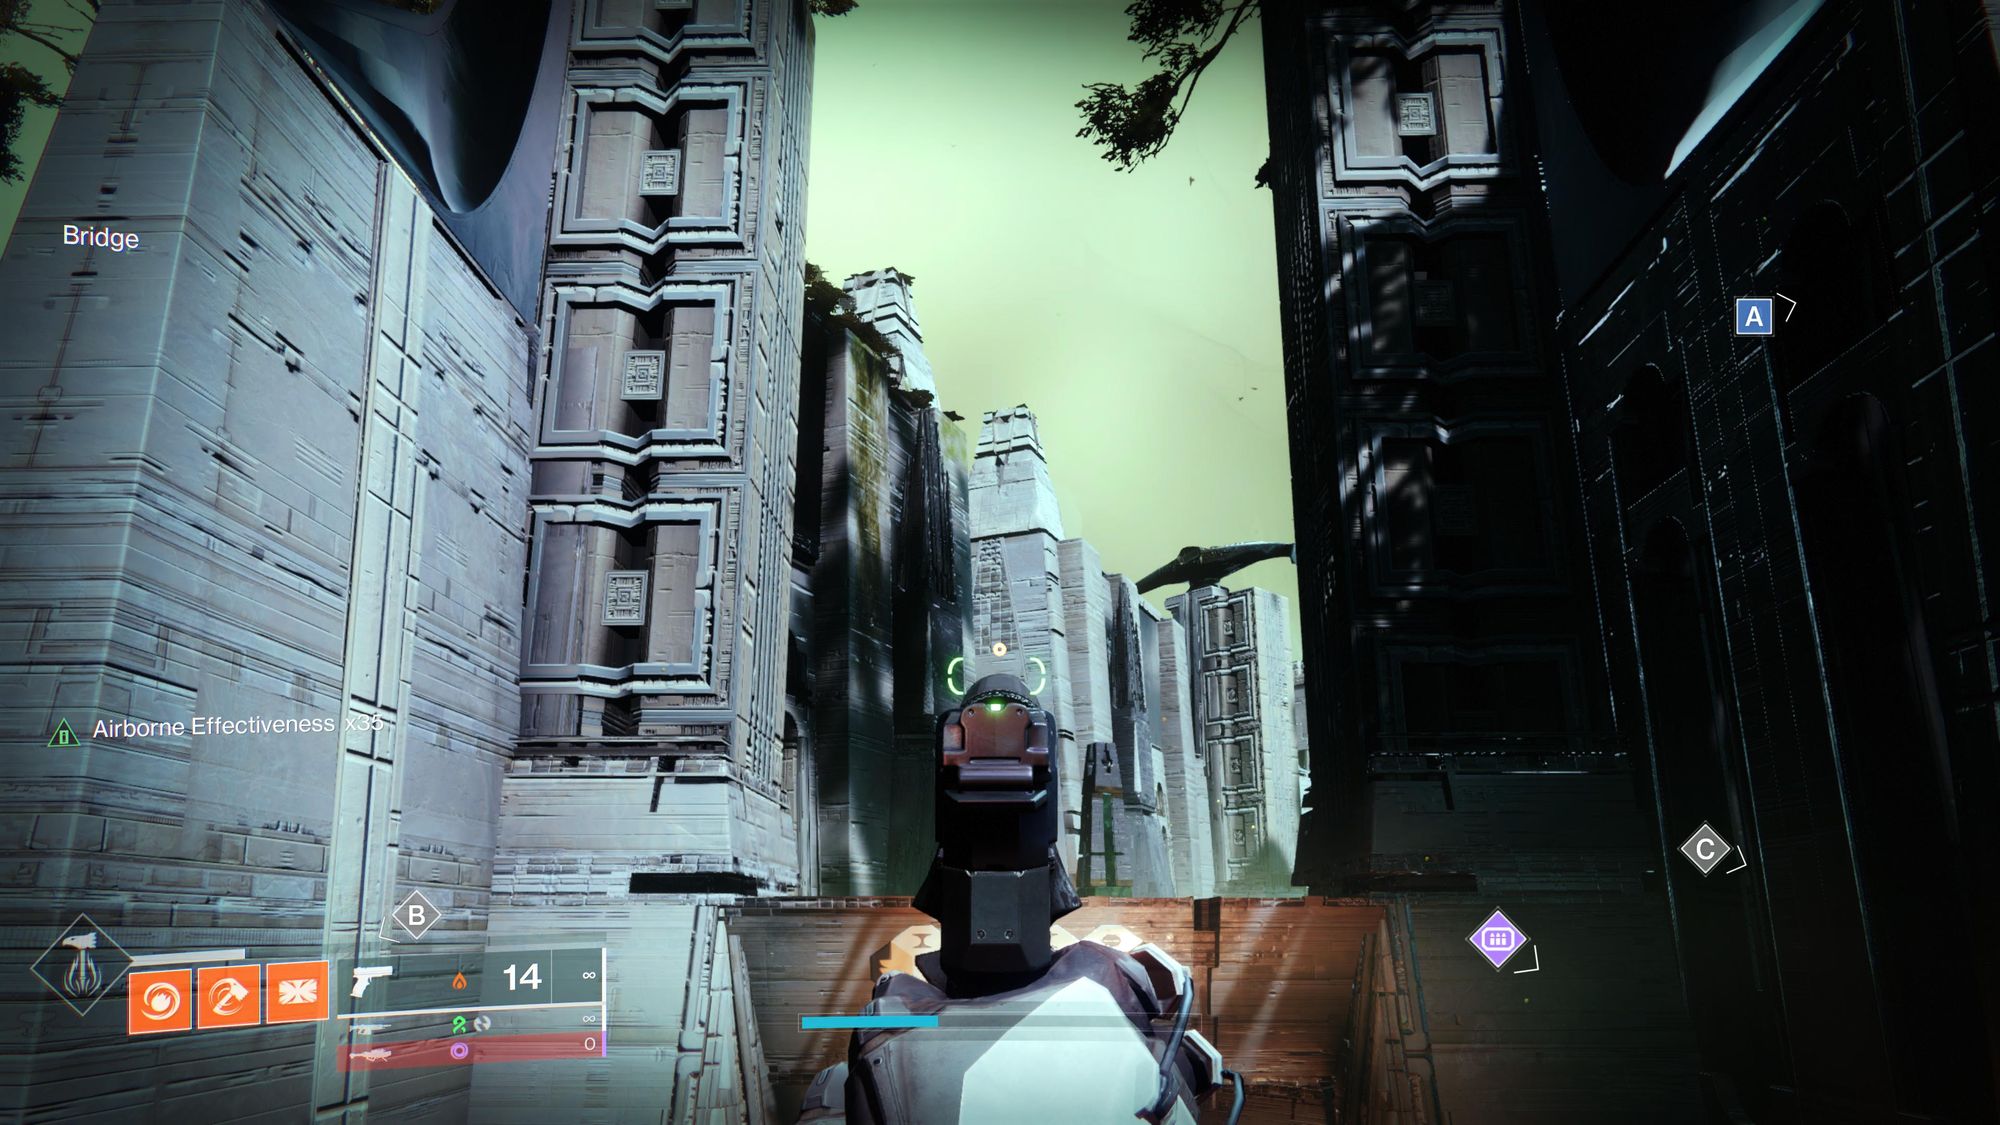
Interestingly, I never noticed the missing ‘peripheral vision blur’ when aiming down sights, but it’s completely gone in the 120 Hz mode. Is this a benefit to me as a player, or a detriment? neither? I really couldn’t say! The main thing I notice though is the added jagged edges on the straight lines of the pillars in this image, produced either by a lower render resolution or less anti-aliasing. Importantly the HUD elements are still at a nice crisp in both though, which I recall Bungie mentioning being important for accessibility reasons. Neat.
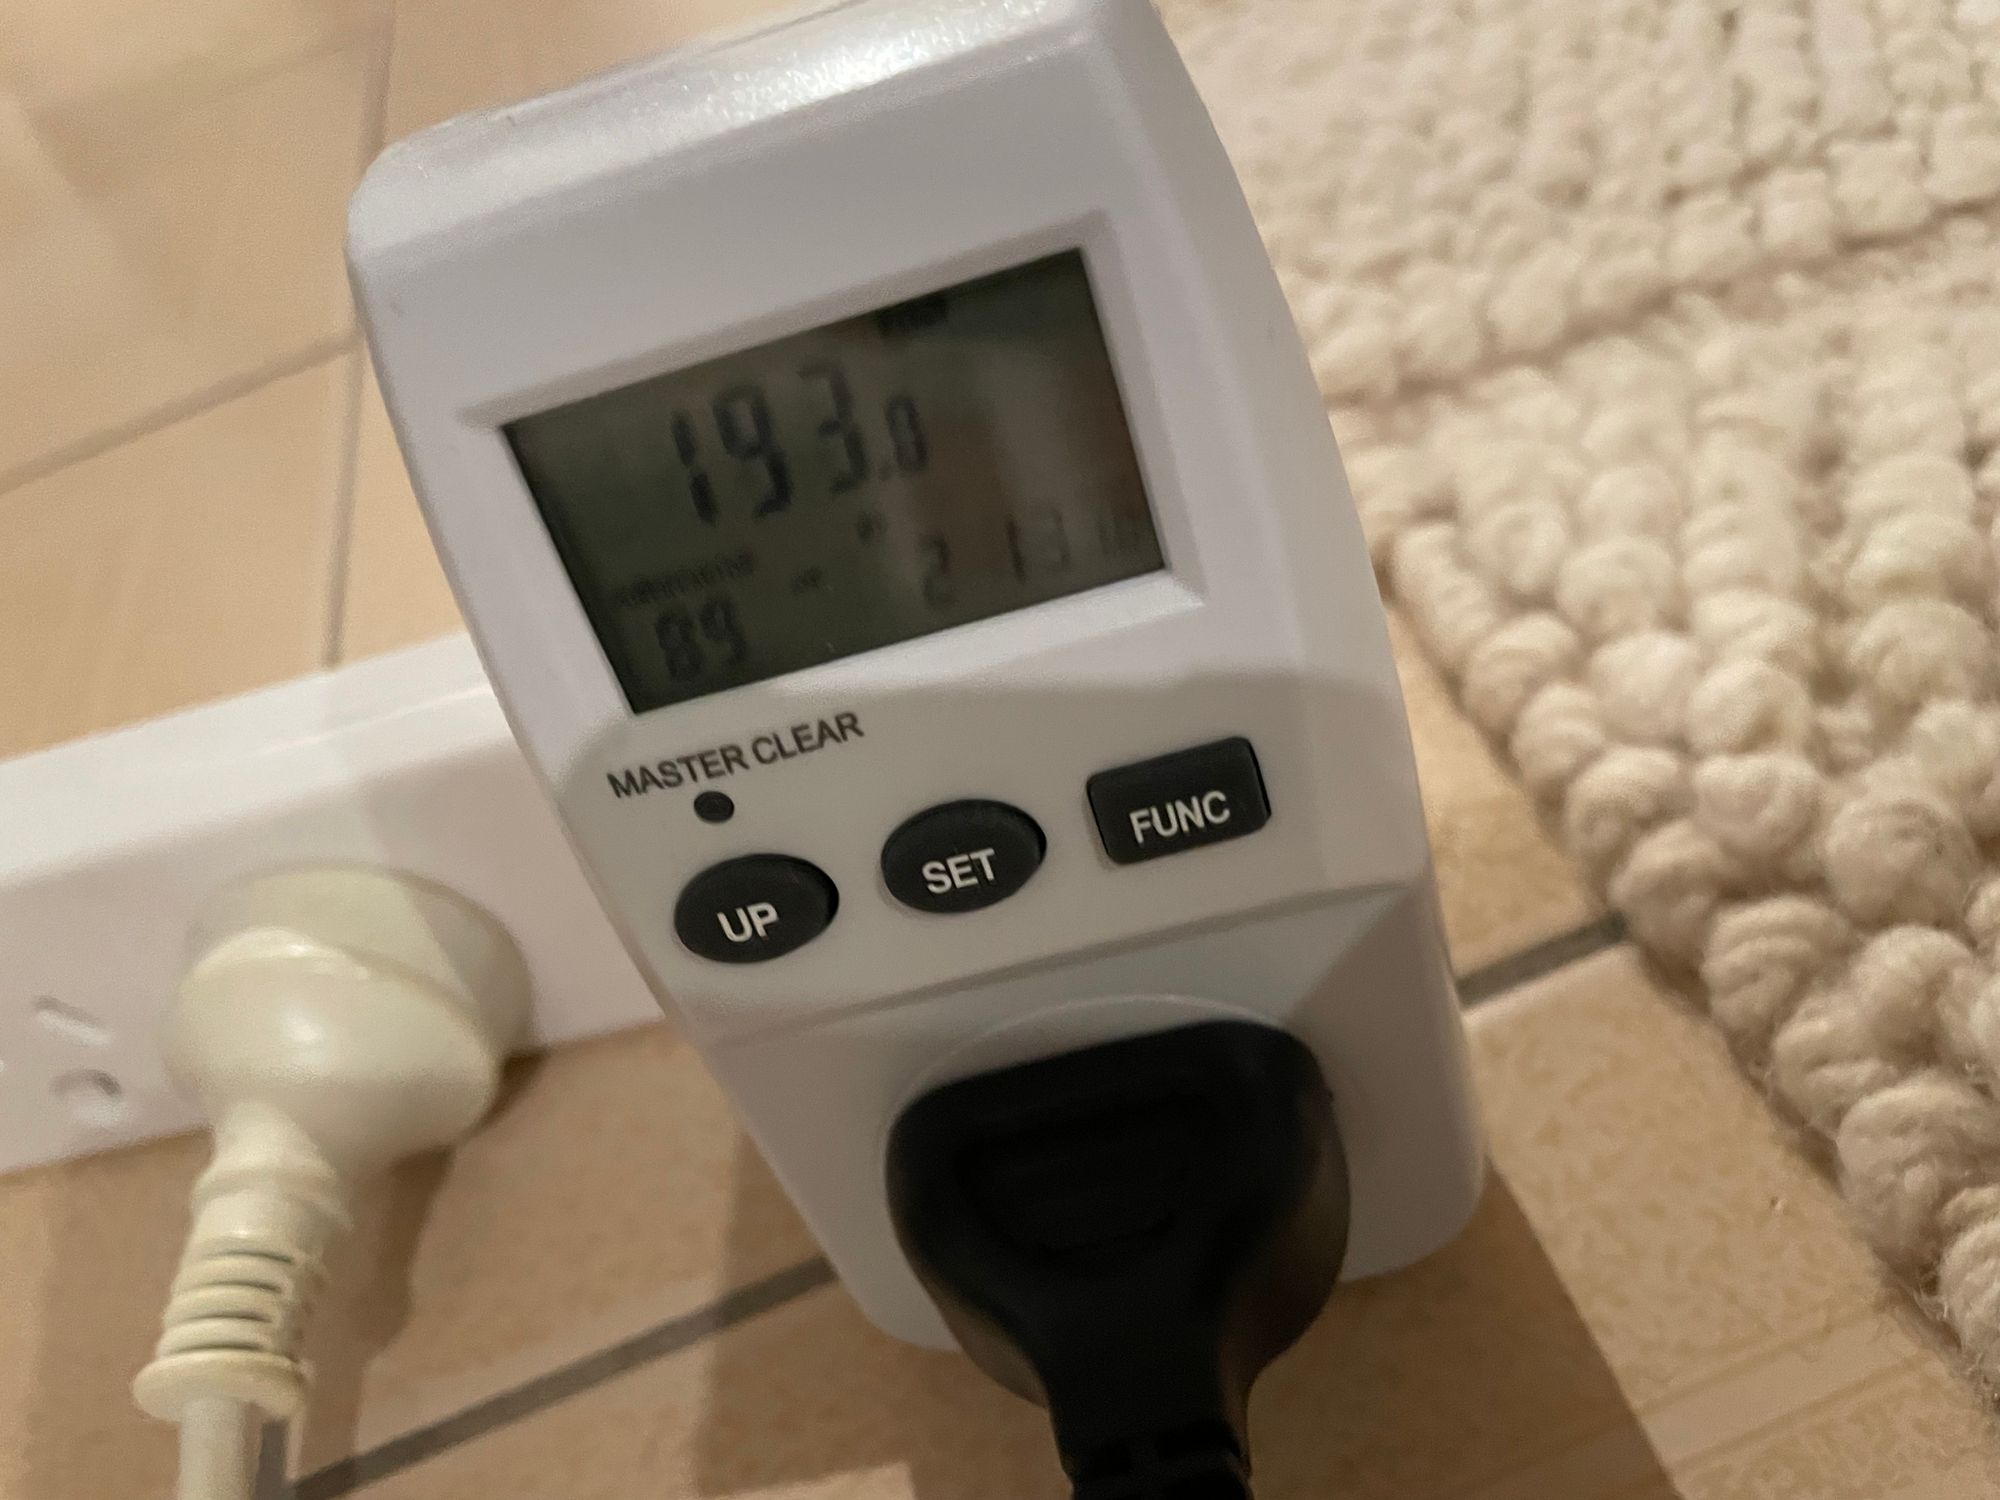
I played a match in the 120 Hz mode, and though its hard to play a competitive shooter while also looking at a power meter, the start of the match showed 190-210-ish watts through the intro screen and the first few seconds of the match
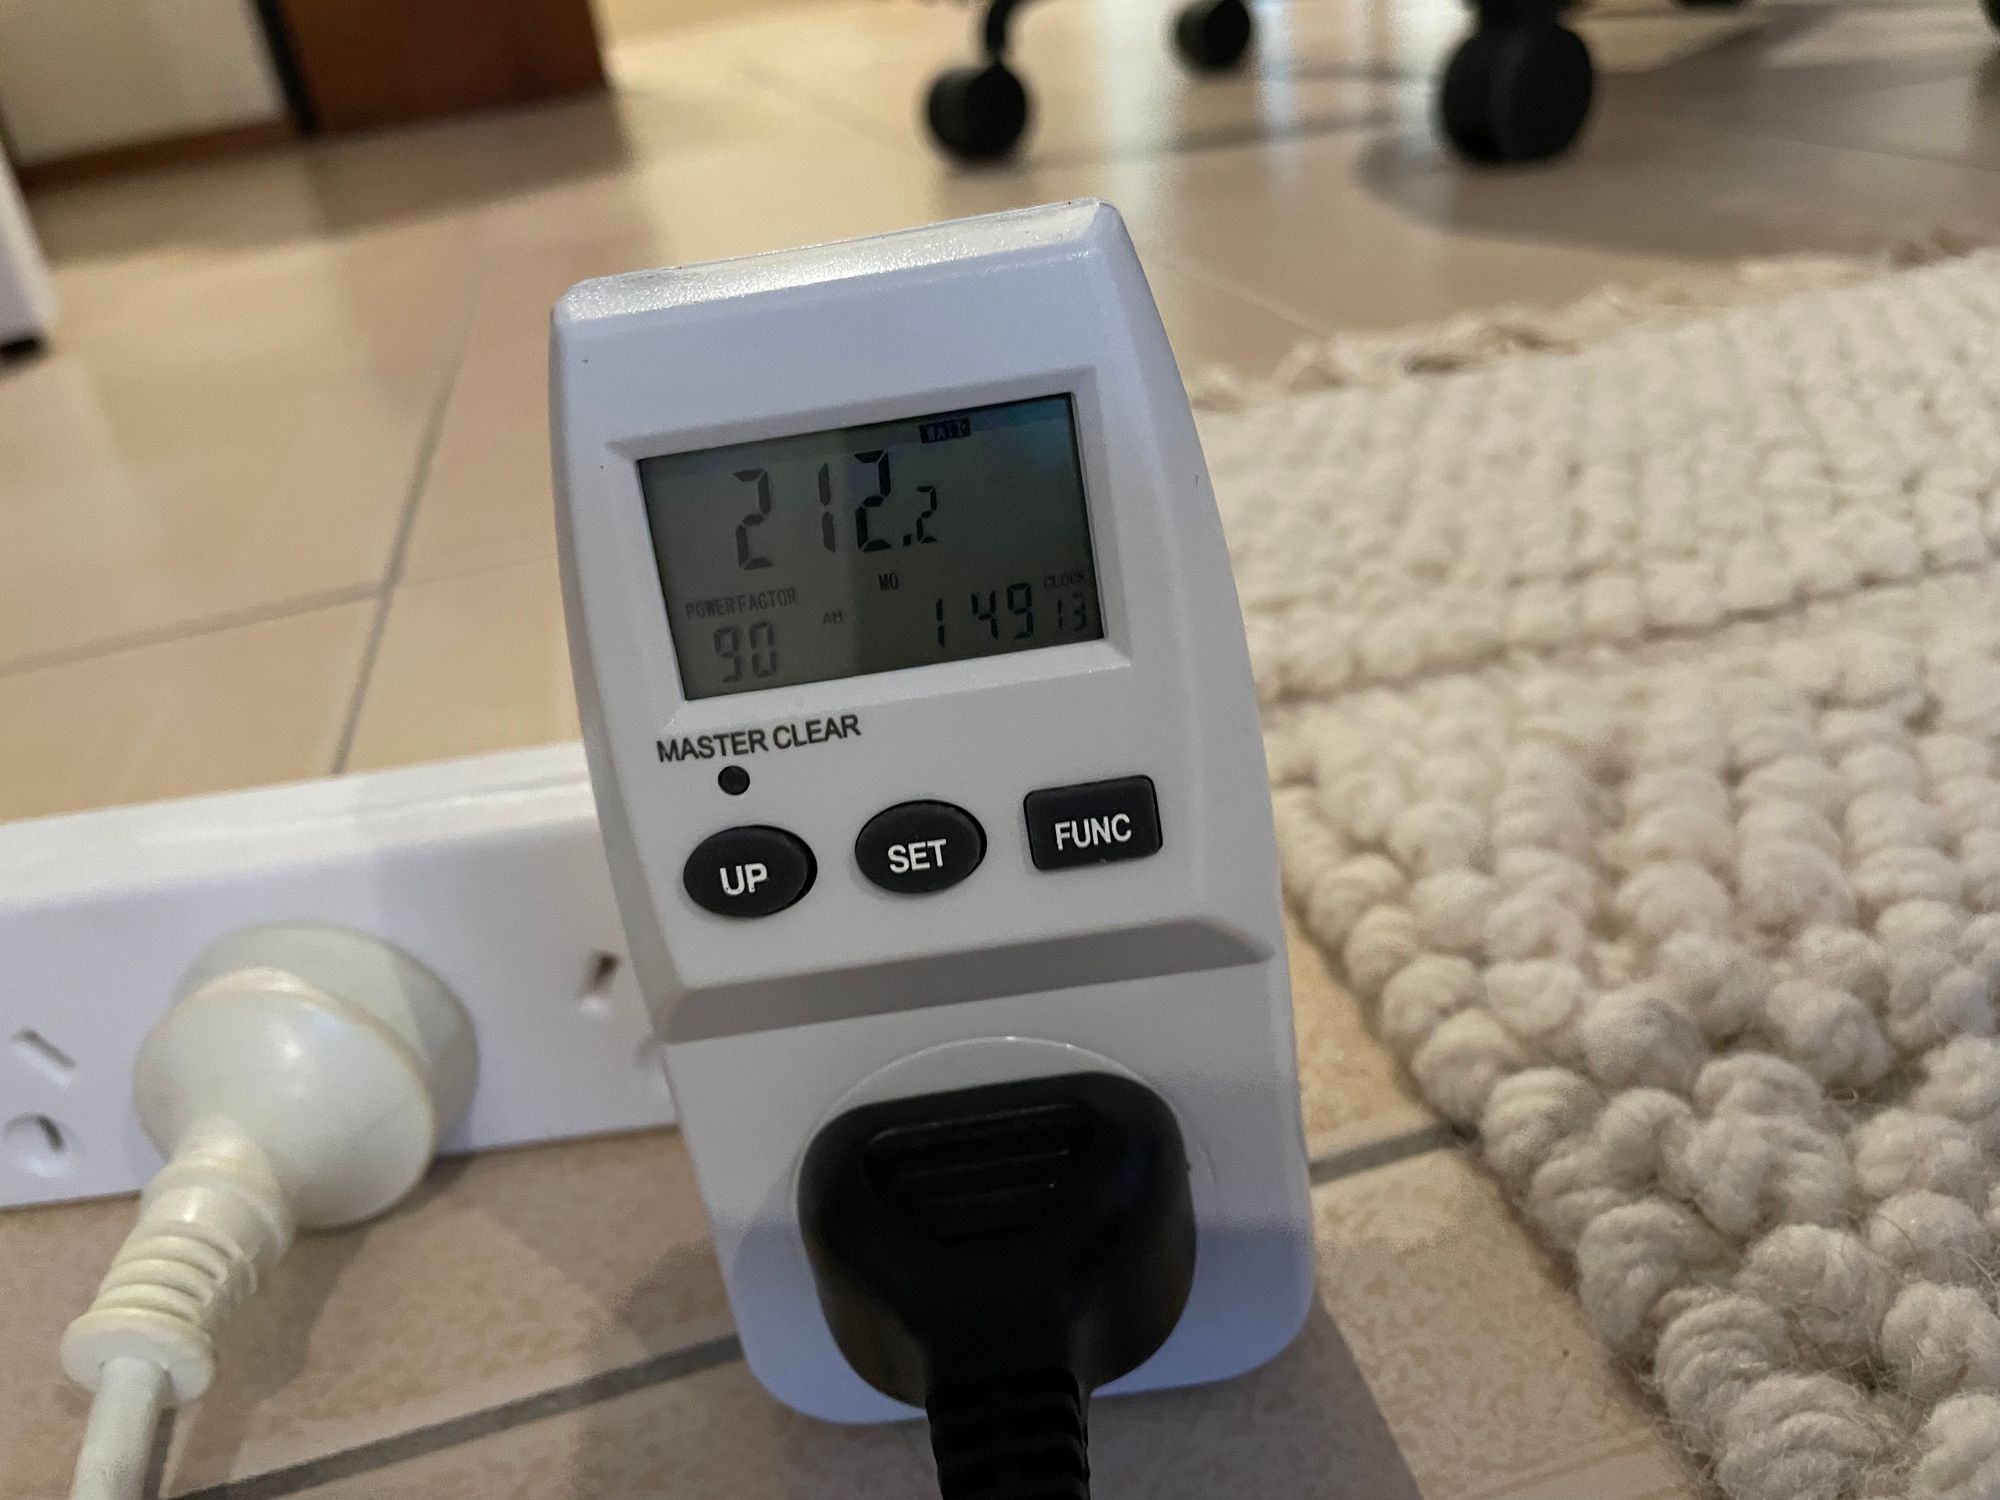
This one ended suuuper super early due to a bug (only one player on the other team, who then left ending it) so I didn’t get a good sense of the power draw since it only lasted one minute or so. A second match, still in 120 Hz mode went for longer, and showed a similar range (glancing at it every time I died) that went as low as 190 watts and as high as 220, as well as at least one measurement of 230 watts while loading in.
Next I disabled the 120 Hz option and played another crucible match, and got… basically the same readings. A low of 190 watts at one point, more typically staying up around 200, and also up to 230 at a few points as well.
Conclusions
So much for big potential saving based on graphics modes! Though admittedly, there are plenty of caveats to this, and it shouldn’t discourage us from further research into what things might actually save energy and emissions – remember that’s the whole point of being economical here. We want to achieve gaming with the lowest footprint possible.
This test is limited limited greatly by a power meter that cost about $20, and which can’t really give super precise results. Future tests like this may require that I upgrade my testing tools! For that I’d need a bit of a budget, however, so become a GTG supporter if you’d like to see that happen.
But even with the data we did manage to gather we did see a slightly surprising finding in both The Witcher 3 and Destiny 2 – because there was basically little to no difference between the two modes, and in The Witcher 3 if anything the more graphics-intense mode seemingly used a fraction less. Perhaps the 60 FPS mode is simply too well–tuned for the capabilities of the PS5. Or perhaps the 30 FPS Graphics mode is reducing the render resolution so dramatically (down from 4K after all!) to hit its FPS target that its under-delivering? It's impossible to know for sure with this setup.
What we would probably need, in order to be able to say definitively, is the ability to run a repeatable benchmarking process, to play through the same long scene or sequence in exactly the same way, for both modes one after the other. There are simply too many variables that go into testing by playing the game “like normal”. In future, an answer could be to set a save point right before a long cutscene and then run through it in both modes.
Another approach that might be useful would also be to setup a side-by-side video of whats on-screen with the live readout from the power plug. It does updates quite slowly this one – polling energy maybe every second or so, and this is probably missing out on identifying power spikes and dips that could be useful. Achieving the 1ms granularity that Xbox’s end user tools claim to have would be super useful.
The Destiny 2 120 Hz mode test also didn’t really show any substantial difference in power – with the actual content of the match and what is on screen at a given time probably more influential. This will always be a problem for a multiplayer mode, and there’s never going to be a way to lock-down an exact sequence to play through over again in the two modes to put measurements side-by-side. Saved replays might get close – but then we also miss live networking demands, data and transfers happening behind the scenes between players, and so on. There’s also no 120Hz mode in other Destiny 2 game modes.
All that just underscores the challenge with optimising for ideal conditions vs the real world – we need to figure out ways to minimise power and emissions for everyone, not just to optimise for one moment, one scene, or one mode of the game.
Aside from the substantial dips in power in non-world scenes and inventory screen seen in The Witcher 3 and (to a lesser extent) in Destiny 2, results were… pretty close to what I expected? Close enough. We didn’t find anything that challenged the working assumptions that resolution and FPS are the main determinants of energy draw, as was put forward by the engineers who presented at GDC in the Xbox presentation. But we also didn’t find any evidence that one mode or another was producing more or less power draw, and this is a little bit contrary to the (unpublished!) testing I saw a few months ago (though this might be down to better testing methods! Until they release the work I can’t really say).
It does point to some potential best-practice for energy saving around ‘pause’ modes though – don’t keep rendering the whole 3D scene when paused! Make a whole new pause screen, if you can, so you’re not refreshing a static image of the 3D game world even in a paused state 30 or 60 times a second. The savings are small – 100 or so watts on consoles (more potentially on PC) – but if you’ve got millions of players, who sit on pause menu screens for minutes or hours a day, you too could make energy and emissions savings equivalent to a small Swedish wind farm!
Thanks for reading Greening the Games Industry – it’s been a little while since the last post as life has gotten in the way.
GTG is now officially over 1 year old! Thanks for sticking around those of you who've been here since the beginning. Thanks for being part of the movement to decarbonise the games industry, wherever you are and however you are doing it.
More soon.